gempy_viewer.plot_3d
- gempy_viewer.plot_3d(model: GeoModel, plotter_type: str = 'basic', active_scalar_field: str | None = None, ve: float | None = None, topography_scalar_type: TopographyDataType = TopographyDataType.GEOMAP, kwargs_pyvista_bounds: dict | None = None, kwargs_pyvista_camera: dict | None = None, kwargs_plot_structured_grid: dict | None = None, kwargs_plot_topography: dict | None = None, kwargs_plot_data: dict | None = None, kwargs_plotter: dict | None = None, kwargs_plot_surfaces: dict | None = None, image: bool = False, show: bool = True, transformed_data: bool = False, show_nugget_effect: bool = False, **kwargs) GemPyToVista[source]
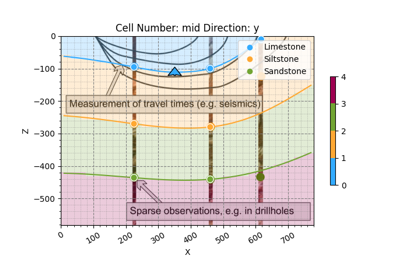
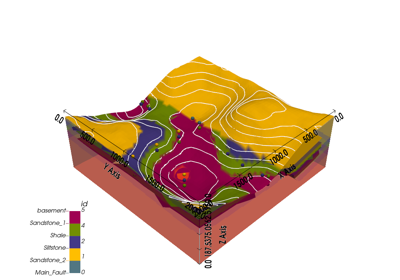
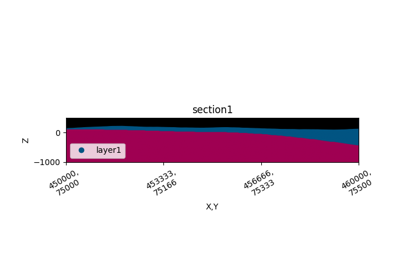
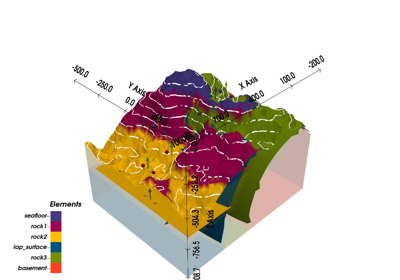
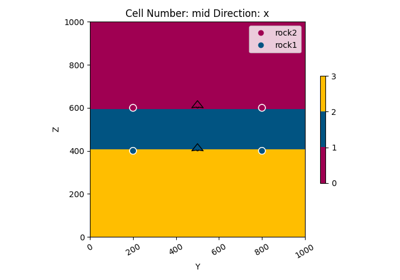
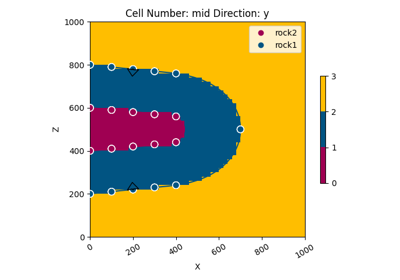
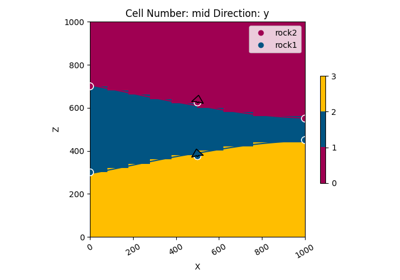
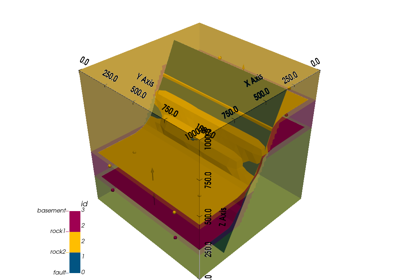
Plots a 3D visualization of a geological model using the GemPy framework and PyVista.
This function generates a 3D visual representation of geological data, including topography, scalar fields, lithology, and structural surfaces. It provides options for customizing the visualization settings using various keyword arguments. The user can control aspects such as whether to plot nugget effects, show scalar fields, enable vertical exaggeration, and much more. The resulting visualization can be displayed interactively or exported as an image.
- Parameters:
model – The geological model (GeoModel) to visualize, which includes information on grid topology, geological structures, and solutions (if available).
plotter_type – The type of PyVista plotter to use. Default is ‘basic’.
active_scalar_field – The scalar field to set as the active field for visualization. Defaults to None.
ve – Vertical exaggeration factor for z-axis scaling. Defaults to None.
topography_scalar_type – Type of scalar data to classify topography, defined as TopographyDataType.
kwargs_pyvista_bounds – Optional dictionary of keyword arguments to customize PyVista bounds.
kwargs_plot_structured_grid – Optional dictionary of keyword arguments to customize the plotting of structured grid data.
kwargs_plot_topography – Optional dictionary of keyword arguments to customize topography visualization.
kwargs_plot_data – Optional dictionary of keyword arguments to customize data visualizations, such as arrows and nugget effects.
kwargs_plotter – Optional dictionary of keyword arguments passed directly to the PyVista plotter.
kwargs_plot_surfaces – Optional dictionary of keyword arguments for customizing the visualization of structural surfaces.
image – Boolean flag to enable saving as an image. If set to True, the visualization will render off-screen. Defaults to False.
show – Boolean flag for displaying the visualization. If False, the visualization is created but not displayed. Defaults to True.
transformed_data – Boolean flag to use transformed (projected) data for visualization instead of raw data. Defaults to False.
show_nugget_effect – Boolean flag that determines if the nugget effect data should be visualized. Defaults to False.
kwargs – Additional keyword arguments for extended functionality. Optional dictionary of miscellaneous settings or configurations.
- Returns:
A GemPyToVista object containing the generated visualization configuration and state.
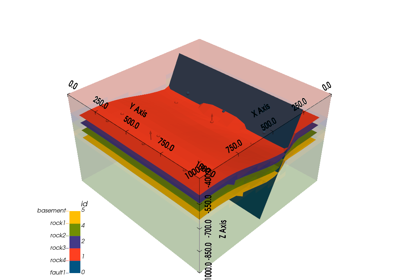
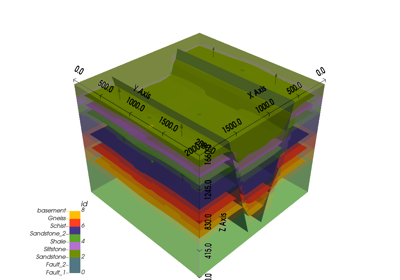
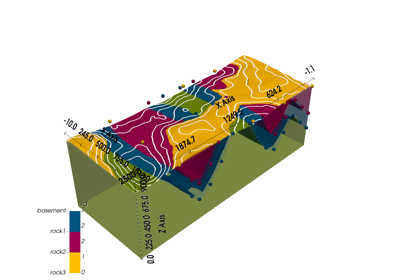
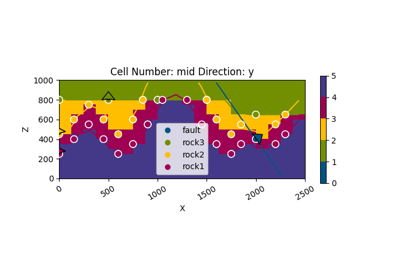
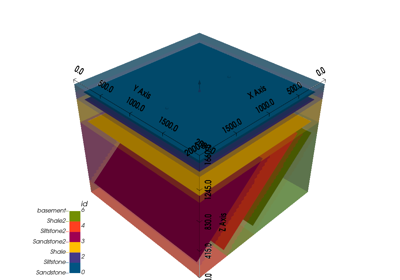
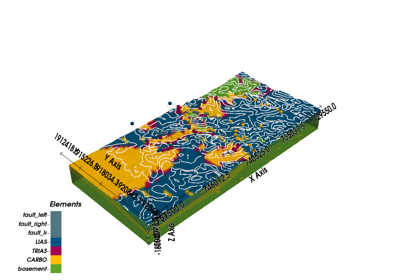
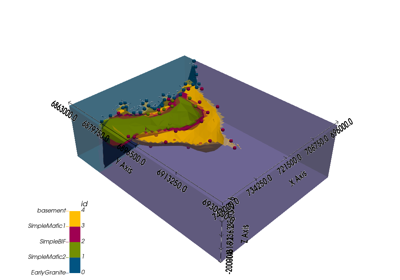
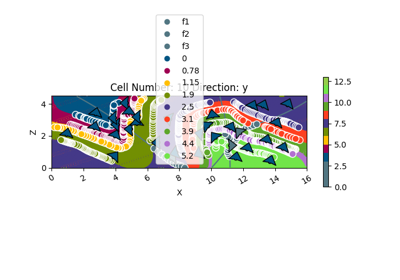
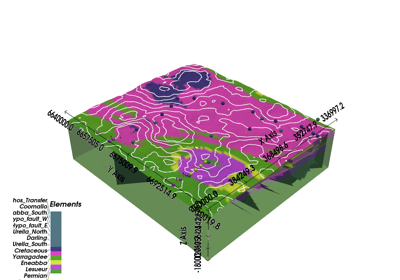
Examples using gempy_viewer.plot_3d
Video Tutorial “code-along”: Modeling step by step
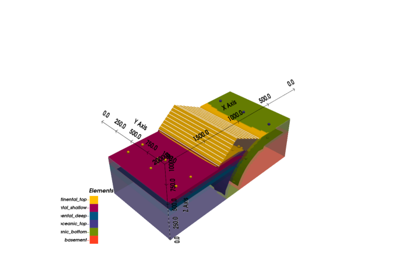
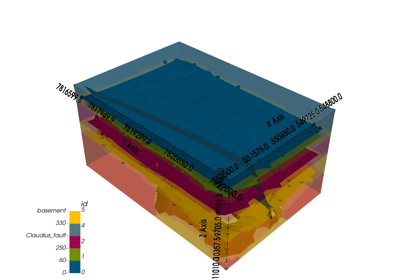
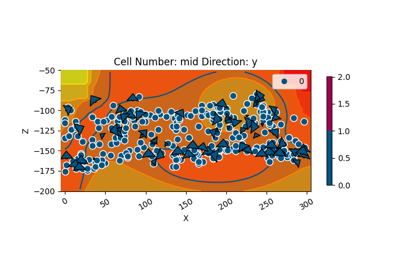

Unknown Model: Importing Borehole Data and Building a 3D Geological Model with GemPy
