Note
Go to the end to download the full example code.
1.4: Unconformity relationships
# sphinx_gallery_thumbnail_number = 2
Importing gempy
import gempy as gp
import gempy_viewer as gpv

# Aux imports
import numpy as np
import os

from gempy_engine.config import AvailableBackends

np.random.seed(1515)
We import a model from an existing folder, representing a subduction zone with onlap relationships.
data_path = os.path.abspath('../../')

geo_model: gp.data.GeoModel = gp.create_geomodel(
    project_name='Onlap_relations',
    extent=[-200, 1000, -500, 500, -1000, 0],
    resolution=[50, 50, 50],
    refinement=6,
    importer_helper=gp.data.ImporterHelper(
        path_to_orientations=data_path + "/data/input_data/tut-ch1-4/tut_ch1-4_orientations.csv",
        path_to_surface_points=data_path + "/data/input_data/tut-ch1-4/tut_ch1-4_points.csv",
    )
)

gp.set_topography_from_random(grid=geo_model.grid, d_z=np.array([-600, -100]))
Active grids: GridTypes.DENSE|TOPOGRAPHY|NONE

Topography(_regular_grid=RegularGrid(resolution=array([50, 50, 50]), extent=array([ -200.,  1000.,  -500.,   500., -1000.,     0.]), values=array([[-188., -490., -990.],
       [-188., -490., -970.],
       [-188., -490., -950.],
       ...,
       [ 988.,  490.,  -50.],
       [ 988.,  490.,  -30.],
       [ 988.,  490.,  -10.]], shape=(125000, 3)), mask_topo=array([], shape=(0, 3), dtype=bool), _transform=None, _base_resolution=array([2, 2, 2])), values_2d=array([[[-200.        , -500.        , -490.4200689 ],
        [-200.        , -479.59183673, -484.26220389],
        [-200.        , -459.18367347, -476.52762029],
        ...,
        [-200.        ,  459.18367347, -489.76830448],
        [-200.        ,  479.59183673, -492.23434556],
        [-200.        ,  500.        , -490.06537167]],

       [[-175.51020408, -500.        , -473.34118994],
        [-175.51020408, -479.59183673, -464.48125719],
        [-175.51020408, -459.18367347, -453.72610953],
        ...,
        [-175.51020408,  459.18367347, -468.62465223],
        [-175.51020408,  479.59183673, -462.58935295],
        [-175.51020408,  500.        , -469.2636671 ]],

       [[-151.02040816, -500.        , -449.61410534],
        [-151.02040816, -479.59183673, -460.05248879],
        [-151.02040816, -459.18367347, -447.43221692],
        ...,
        [-151.02040816,  459.18367347, -436.68329324],
        [-151.02040816,  479.59183673, -438.01738023],
        [-151.02040816,  500.        , -445.13576149]],

       ...,

       [[ 951.02040816, -500.        , -496.52896451],
        [ 951.02040816, -479.59183673, -505.19573946],
        [ 951.02040816, -459.18367347, -524.20538843],
        ...,
        [ 951.02040816,  459.18367347, -506.14201021],
        [ 951.02040816,  479.59183673, -509.67069846],
        [ 951.02040816,  500.        , -509.34420274]],

       [[ 975.51020408, -500.        , -479.2213275 ],
        [ 975.51020408, -479.59183673, -498.44163414],
        [ 975.51020408, -459.18367347, -503.30361442],
        ...,
        [ 975.51020408,  459.18367347, -505.78969505],
        [ 975.51020408,  479.59183673, -501.88634872],
        [ 975.51020408,  500.        , -498.15612849]],

       [[1000.        , -500.        , -482.92487316],
        [1000.        , -479.59183673, -483.36398681],
        [1000.        , -459.18367347, -489.07270116],
        ...,
        [1000.        ,  459.18367347, -508.13810685],
        [1000.        ,  479.59183673, -499.68180865],
        [1000.        ,  500.        , -498.66045422]]], shape=(50, 50, 3)), source=None, values=array([[-200.        , -500.        , -490.4200689 ],
       [-200.        , -479.59183673, -484.26220389],
       [-200.        , -459.18367347, -476.52762029],
       ...,
       [1000.        ,  459.18367347, -508.13810685],
       [1000.        ,  479.59183673, -499.68180865],
       [1000.        ,  500.        , -498.66045422]], shape=(2500, 3)), resolution=(50, 50), raster_shape=())
gpv.plot_2d(geo_model)
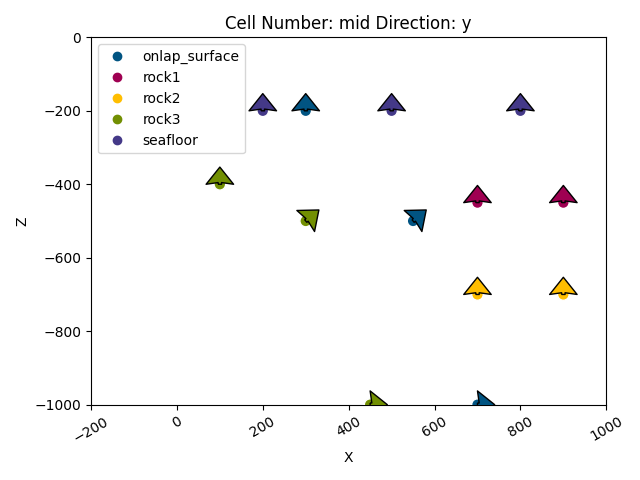
<gempy_viewer.modules.plot_2d.visualization_2d.Plot2D object at 0x7f5820c81bd0>
Raw structural frame
geo_model.input_transform.apply_anisotropy(gp.data.GlobalAnisotropy.NONE)
gp.add_structural_group(
    model=geo_model,
    group_index=0,
    structural_group_name="seafloor_series",
    elements=[geo_model.structural_frame.get_element_by_name("seafloor")],
    structural_relation=gp.data.StackRelationType.ERODE,
)

gp.add_structural_group(
    model=geo_model,
    group_index=1,
    structural_group_name="right_series",
    elements=[
        geo_model.structural_frame.get_element_by_name("rock1"),
        geo_model.structural_frame.get_element_by_name("rock2"),
    ],
    structural_relation=gp.data.StackRelationType.ONLAP
)

gp.add_structural_group(
    model=geo_model,
    group_index=2,
    structural_group_name="onlap_series",
    elements=[geo_model.structural_frame.get_element_by_name("onlap_surface")],
    structural_relation=gp.data.StackRelationType.ERODE
)

gp.add_structural_group(
    model=geo_model,
    group_index=3,
    structural_group_name="left_series",
    elements=[geo_model.structural_frame.get_element_by_name("rock3")],
    structural_relation=gp.data.StackRelationType.BASEMENT
)

gp.remove_structural_group_by_name(model=geo_model, group_name="default_formation")

# Final structural frame
geo_model.structural_frame
s = gp.compute_model(
    gempy_model=geo_model,
    engine_config=gp.data.GemPyEngineConfig(
        backend=AvailableBackends.PYTORCH
    )
)
Setting Backend To: AvailableBackends.PYTORCH
GPU requested but unavailable; falling back to CPU (GEMPY_GPU_FALLBACK=True)
Setting Backend To: AvailableBackends.PYTORCH
Chunking done: 6 chunks
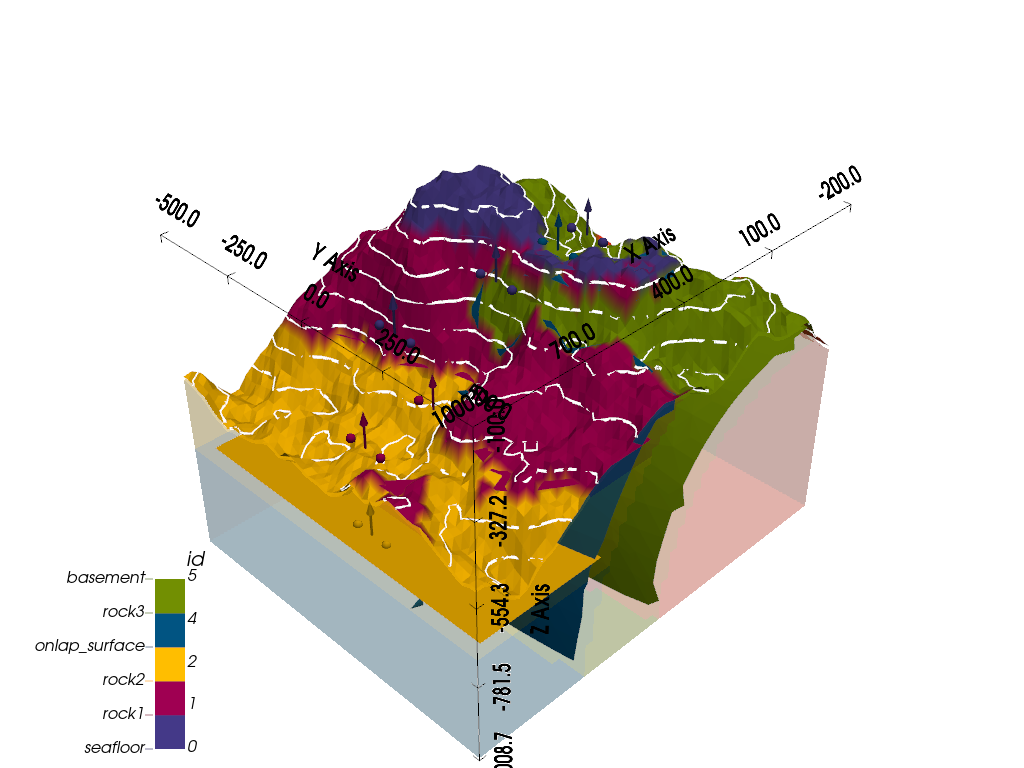
<gempy_viewer.modules.plot_3d.vista.GemPyToVista object at 0x7f5820cd0bb0>
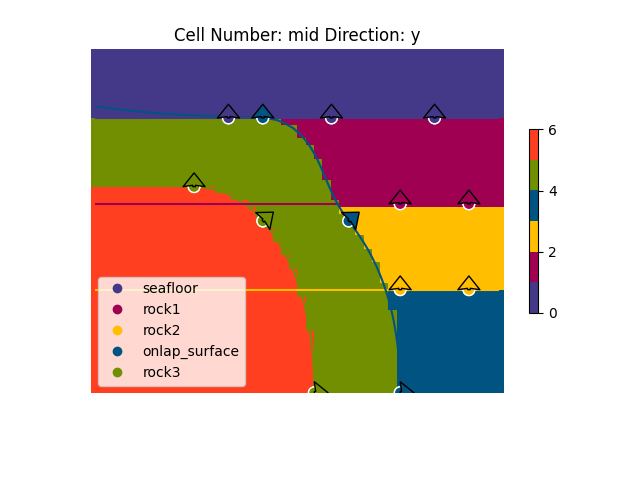
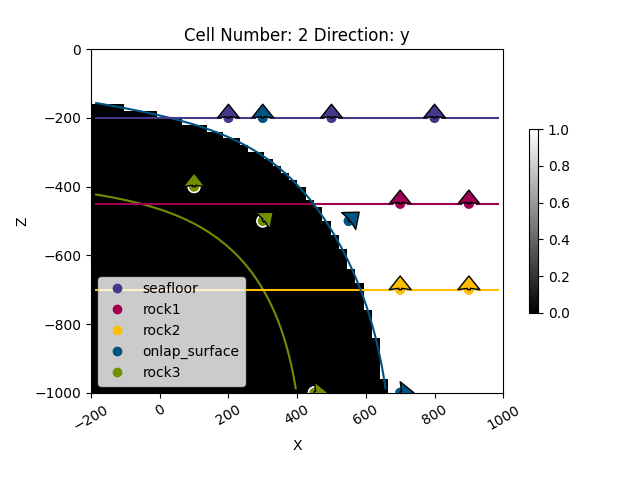
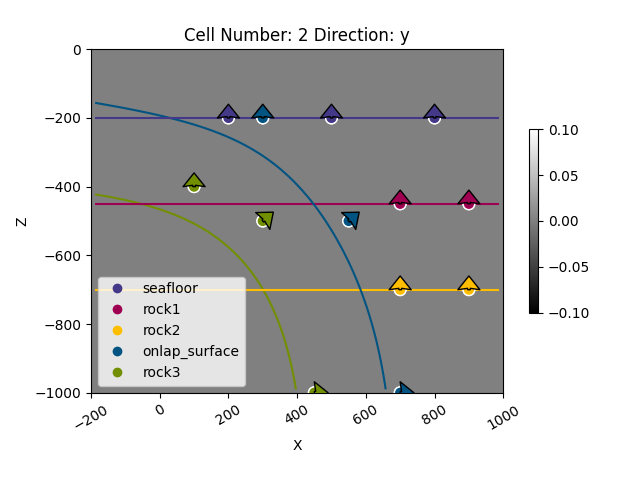
gpv.plot_2d(
model=geo_model,
cell_number=2,
override_regular_grid=geo_model.solutions.raw_arrays.mask_matrix[0],
show_data=True, kwargs_lithology={'cmap': 'gray', 'norm': None}
)
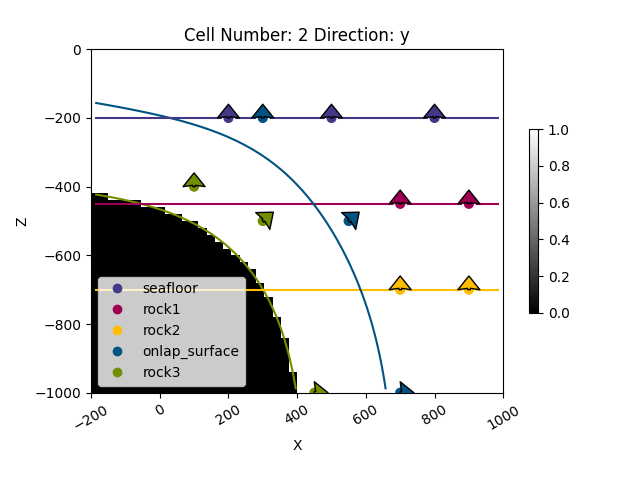
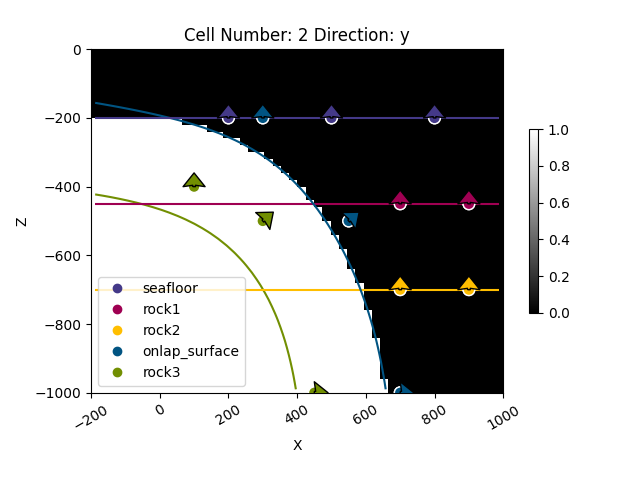
gpv.plot_2d(
model=geo_model,
cell_number=2,
override_regular_grid=geo_model.solutions.raw_arrays.mask_matrix[1],
show_data=True, kwargs_lithology={'cmap': 'gray', 'norm': None}
)
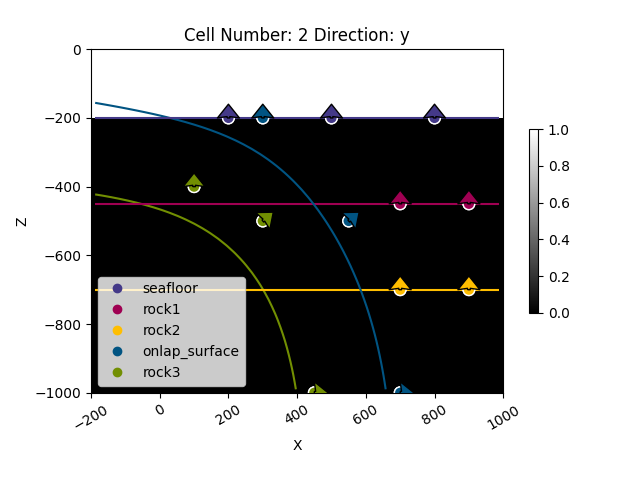
gpv.plot_2d(
model=geo_model,
cell_number=2,
override_regular_grid=geo_model.solutions.raw_arrays.mask_matrix[2],
show_data=True, kwargs_lithology={'cmap': 'gray', 'norm': None}
)
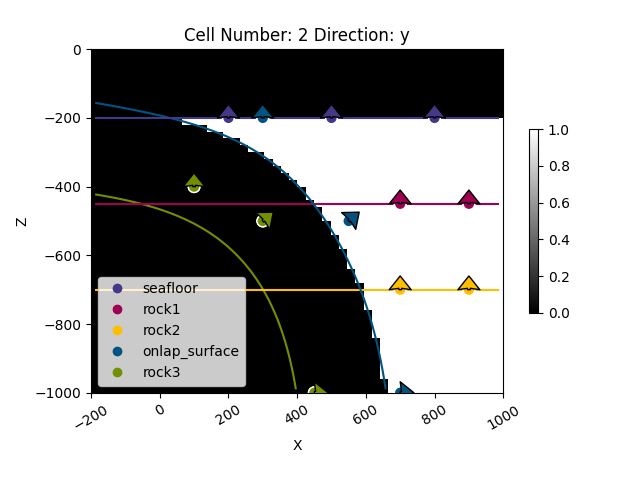
gpv.plot_2d(
model=geo_model,
cell_number=2,
override_regular_grid=geo_model.solutions.raw_arrays.mask_matrix[3],
show_data=True, kwargs_lithology={'cmap': 'gray', 'norm': None}
)

<gempy_viewer.modules.plot_2d.visualization_2d.Plot2D object at 0x7f582064e750>
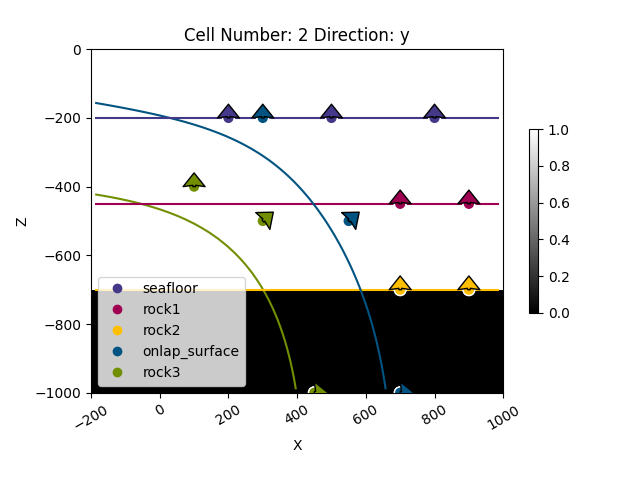
gpv.plot_2d(
    model=geo_model,
    cell_number=2,
    override_regular_grid=geo_model.solutions.raw_arrays.mask_matrix_squeezed[0],
    show_data=True, kwargs_lithology={'cmap': 'gray', 'norm': None}
)

gpv.plot_2d(
    model=geo_model,
    cell_number=2,
    override_regular_grid=geo_model.solutions.raw_arrays.mask_matrix_squeezed[1],
    show_data=True, kwargs_lithology={'cmap': 'gray', 'norm': None}
)

gpv.plot_2d(
    model=geo_model,
    cell_number=2,
    override_regular_grid=geo_model.solutions.raw_arrays.mask_matrix_squeezed[2],
    show_data=True, kwargs_lithology={'cmap': 'gray', 'norm': None}
)

gpv.plot_2d(
    model=geo_model,
    cell_number=2,
    override_regular_grid=geo_model.solutions.raw_arrays.mask_matrix_squeezed[3],
    show_data=True, kwargs_lithology={'cmap': 'gray', 'norm': None}
)
<gempy_viewer.modules.plot_2d.visualization_2d.Plot2D object at 0x7f5820e76a50>
Total running time of the script: (0 minutes 7.439 seconds)
