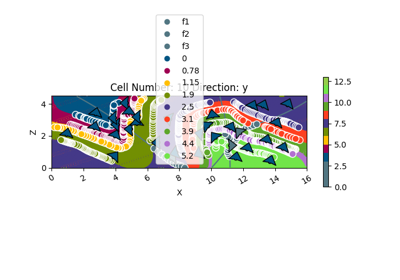
gempy_viewer.plot_2d
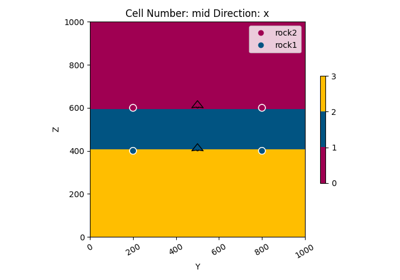
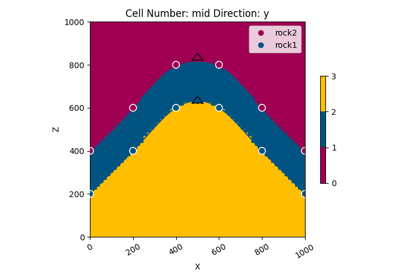
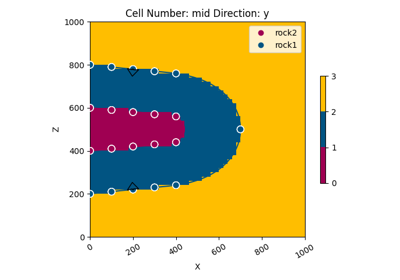
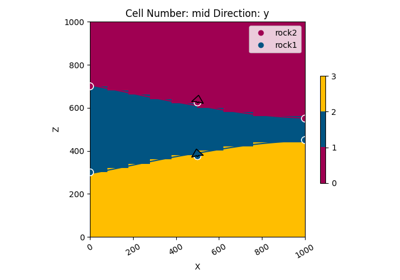
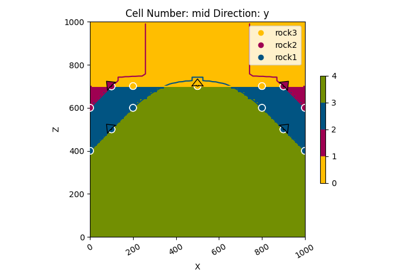
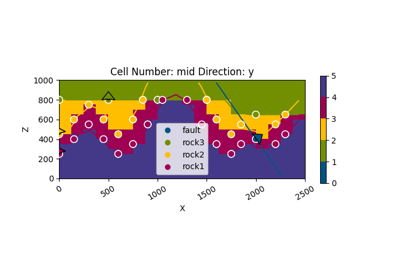
- gempy_viewer.plot_2d(model: GeoModel, n_axis=None, section_names: list = None, cell_number: int | list[int] | str | list[str] | None = None, direction: str | list[str] | None = 'y', series_n: int | List[int] = 0, legend: bool = True, ve=1, block=None, override_regular_grid=None, kwargs_topography=None, kwargs_lithology=None, kwargs_scalar_field=None, kwargs_boundaries=None, **kwargs) Plot2D[source]
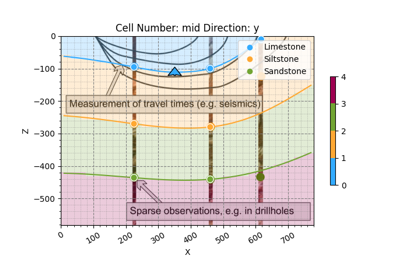
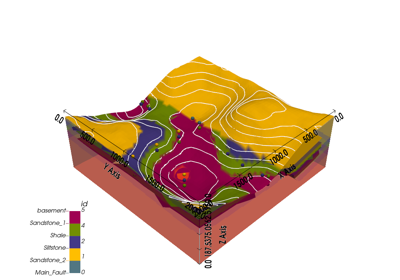
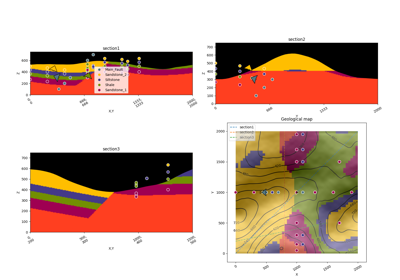
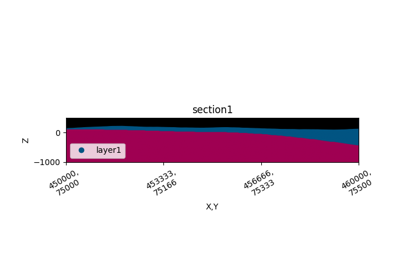
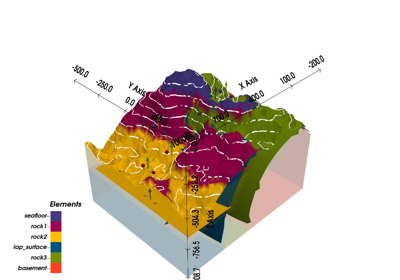
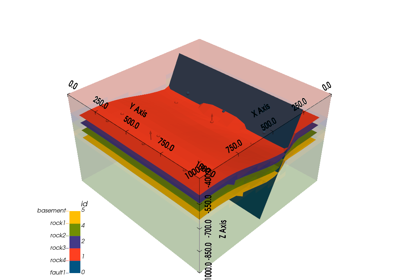
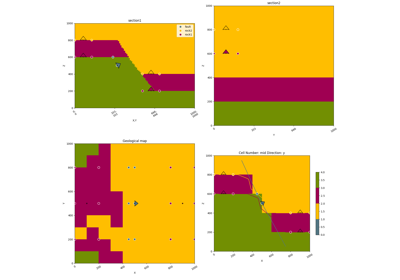
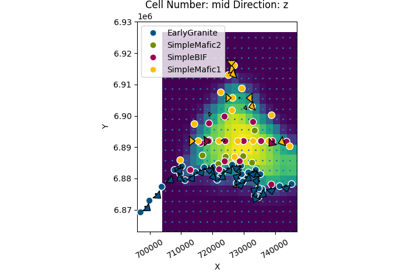
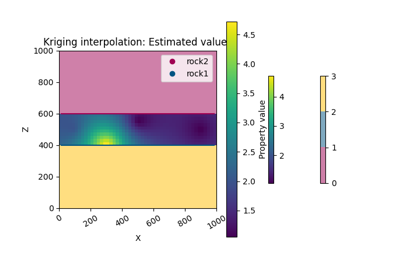
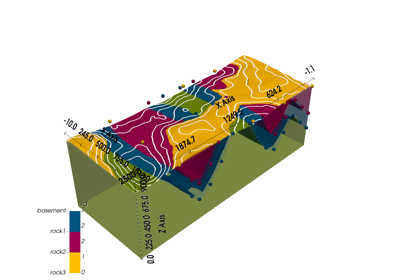
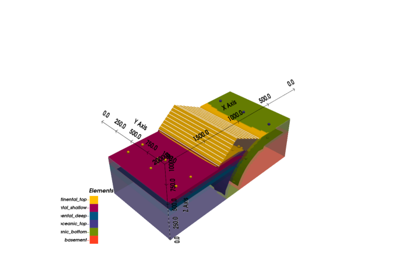
Plot 2-D sections of the geomodel.
This function plots cross-sections either based on custom section traces or cell numbers in the xyz directions. Options are provided to plot lithology blocks, scalar fields, or rendered surface lines. Input data and topography can be included.
- Parameters:
model (GeoModel) – Geomodel object with solutions.
n_axis (Optional[int]) – Subplot axis for multiple sections.
section_names (Optional[List[str]]) – Names of predefined custom section traces.
cell_number (Optional[Union[int, List[int], str, List[str]]]) – Position of the array to plot.
direction (Optional[Union[str, List[str]]]) – Cartesian direction to be plotted (xyz).
series_n (Union[int, List[int]]) – Number of the scalar field.
legend (bool) – If True, plot legend. Defaults to True.
ve (float) – Vertical exaggeration. Defaults to 1.
block (Optional[np.ndarray]) – Deprecated. Use regular grid instead.
override_regular_grid (Optional[np.ndarray]) – Numpy array of the size of model.grid.regular_grid. If provided, the regular grid will be overridden by this array.
kwargs_topography (Optional[dict]) – Additional keyword arguments for topography. * fill_contour: Fill contour flag. * hillshade (bool): Calculate and add hillshading using elevation data. * azdeg (float): Azimuth of sun for hillshade. - altdeg (float): Altitude in degrees of sun for hillshade.
kwargs_lithology (Optional[dict]) – Additional keyword arguments for lithology.
kwargs_scalar_field (Optional[dict]) – Additional keyword arguments for scalar field.
- Keyword Arguments:
show_block (bool) – If True and the model has been computed, plot cross section of the final model.
show_values (bool) – If True and the model has been computed, plot cross section of the value.
show (bool) – Call matplotlib show. Defaults to True.
show_data (bool) – Show original input data. Defaults to True.
show_results (bool) – If False, override show lithology, scalar field, and values. Defaults to True.
show_lith (bool) – Show lithological block volumes. Defaults to True.
show_scalar (bool) – Show scalar field isolines. Defaults to False.
show_boundaries (bool) – Show surface boundaries as lines. Defaults to True.
show_topography (bool) – Show topography on plot. Defaults to False.
show_section_traces (bool) – Show section traces. Defaults to True.
- Returns:
Plot2D object.
- Return type:
gempy.plot.visualization_2d.Plot2D
Examples using gempy_viewer.plot_2d
Video Tutorial “code-along”: Modeling step by step


Unknown Model: Importing Borehole Data and Building a 3D Geological Model with GemPy
