Note
Go to the end to download the full example code.
Geomodeling benchmark: the “Hecho”-Model
This model is part of a geomodeling benchmaring effort. More information (and, hopefully, publication) coming.
import os

import numpy as np
# Aux imports
import pandas as pn
from gempy.modules.serialization.save_load import _validate_serialization

# Importing gempy
import gempy as gp
import gempy_viewer as gpv
Loading surface points from repository:
With pandas we can do it directly from the web and with the right args we can directly tidy the data in gempy style:
data_path = os.path.abspath('../../data/input_data/Hecho')
dfs = []

# First stratigraphic data
for letter in range(1, 10):
    dfs.append(pn.read_csv(
        filepath_or_buffer=data_path + '/H' + str(letter) + '.csv',
        sep=';',
        names=['X', 'Y', 'Z', 'surface', '_'],
        header=0
    ))

# Also faults
for f in range(1, 4):
    fault_df = pn.read_csv(
        filepath_or_buffer=data_path + '/F' + str(f) + 'Line.csv',
        sep=';',
        names=['X', 'Y', 'Z'],
        header=0
    )
    fault_df['surface'] = 'f' + str(f)
    dfs.append(fault_df)

# We put all the surfaces points together because is how gempy likes it:
surface_points = pn.concat(dfs, sort=True)
surface_points.reset_index(inplace=True, drop=False)
surface_points.tail()
Now we do the same with the orientations:
orientations = pn.read_csv(
    filepath_or_buffer=data_path + '/Dips.csv',
    sep=';',
    names=['X', 'Y', 'Z', 'G_x', 'G_z', '_'],
    header=0
)
# Orientation needs to belong to a surface. This is mainly to categorize to which series belong and to
# use the same color
orientations['surface'] = 0

# We fill the laking direction with a dummy value:
orientations['G_y'] = 0

# Replace -99999.00000 with NaN
orientations.replace(-99999.00000, np.nan, inplace=True)

# Drop irrelevant columns
orientations.drop(columns=['_'], inplace=True)

# Remove rows containing NaN
orientations.dropna(inplace=True)
Data initialization:
Suggested size of the axis-aligned modeling box: Origin: 0 -0.5 0 Maximum: 16 0.5 4.5
Suggested resolution: 0.05m (grid size 321 x 21 x 91)
%%
surface_points_table: gp.data.SurfacePointsTable = gp.data.SurfacePointsTable.from_arrays(
    x=surface_points['X'].values,
    y=surface_points['Y'].values,
    z=surface_points['Z'].values,
    names=surface_points['surface'].values.astype(str)
)

orientations_table: gp.data.OrientationsTable = gp.data.OrientationsTable.from_arrays(
    x=orientations['X'].values,
    y=orientations['Y'].values,
    z=orientations['Z'].values,
    G_x=orientations['G_x'].values,
    G_y=orientations['G_y'].values,
    G_z=orientations['G_z'].values,
    names=orientations['surface'].values.astype(str),
    name_id_map=surface_points_table.name_id_map  # ! Make sure that ids and names are shared
)

structural_frame: gp.data.StructuralFrame = gp.data.StructuralFrame.from_data_tables(
    surface_points=surface_points_table,
    orientations=orientations_table
)

geo_model: gp.data.GeoModel = gp.create_geomodel(
    project_name='Moureze',
    extent=[0, 16, -0.5, 0.5, 0, 4.5],
    resolution=[321, 21, 91],
    structural_frame=structural_frame
)

gp.set_section_grid(
    grid=geo_model.grid,
    section_dict={
            'section': ((0., 0.), (16., 0.), (321, 91))
    },
)
Active grids: GridTypes.DENSE|SECTIONS|NONE
We need an orientation per series/fault. The faults does not have orientation so the easiest is to create an orientation from the surface points availablle:
f_names = ['f1', 'f2', 'f3']
for fn in f_names:
    element = geo_model.structural_frame.get_element_by_name(fn)
    new_orientations = gp.create_orientations_from_surface_points_coords(
        xyz_coords=element.surface_points.xyz
    )
    gp.add_orientations(
        geo_model=geo_model,
        x=new_orientations.data['X'],
        y=new_orientations.data['Y'],
        z=new_orientations.data['Z'],
        pole_vector=new_orientations.grads,
        elements_names=fn,
        name_id_map=element.surface_points.name_id_map
    )
Now we can see how the data looks so far:
gpv.plot_2d(geo_model)
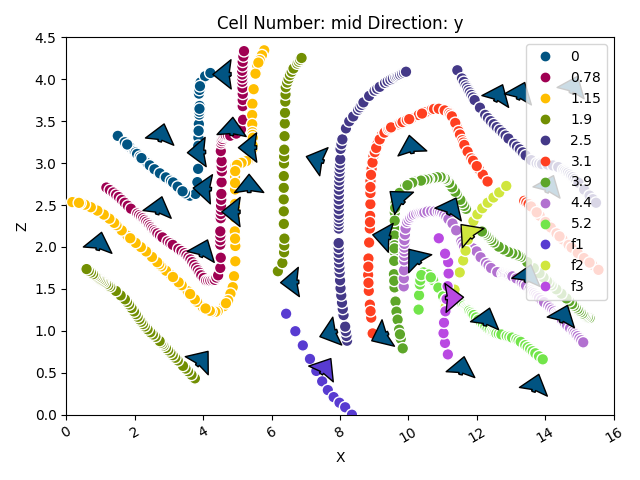
<gempy_viewer.modules.plot_2d.visualization_2d.Plot2D object at 0x7f57801a1750>
By default all surfaces belong to one unique series.
We will need to separate with surface belong to each series:
gp.map_stack_to_surfaces(
    gempy_model=geo_model,
    mapping_object={'Fault1': 'f1', 'Fault2': 'f2', 'Fault3': 'f3'}
)
However if we want the faults to offset the “Default series”, they will need to be more recent (higher on the pile). We can modify the order by:
Lastly, so far we did not specify which series/faults are actula faults:
gp.set_is_fault(
    frame=geo_model,
    fault_groups=['Fault1', 'Fault2', 'Fault3']
)
The default range is always the diagonal of the extent. Since in this model data is very close we will need to reduce the range to 5-10% of that value:
geo_model.interpolation_options.kernel_options.range *= 0.2
Explanation of model characteristics and adjustments This model has characteristics that make it difficult to get the right default values: - It is large, and we want high resolution - Some series have a large conditional number (i.e., the model input is not very stable) To address these issues: - Reduce the chunk size during evaluation to trade speed for memory - Reduce the std of the error parameter in octree refinement, which evaluates fewer voxels but may leave some without refinement Enable debugging options to help tune these parameters.
Setting verbose and condition number options for debugging
geo_model.interpolation_options.kernel_options.compute_condition_number = True
gp.compute_model(
    gempy_model=geo_model,
    engine_config=gp.data.GemPyEngineConfig(
        backend=gp.data.AvailableBackends.PYTORCH,
        dtype='float64'
    ),
    validate_serialization=True
)
Setting Backend To: AvailableBackends.PYTORCH
GPU requested but unavailable; falling back to CPU (GEMPY_GPU_FALLBACK=True)
Setting Backend To: AvailableBackends.PYTORCH
Condition number: 1546449.7334630876.
Chunking done: 21 chunks
Condition number: 1545102.6430502783.
Chunking done: 26 chunks
Condition number: 1447785.0114887375.
Chunking done: 21 chunks
Condition number: 40165630.351970166.
Chunking done: 1052 chunks
Chunking done: 9 chunks
Chunking done: 59 chunks
Chunking done: 32 chunks
gpv.plot_2d(geo_model, cell_number=[10], series_n=3, show_scalar=True)
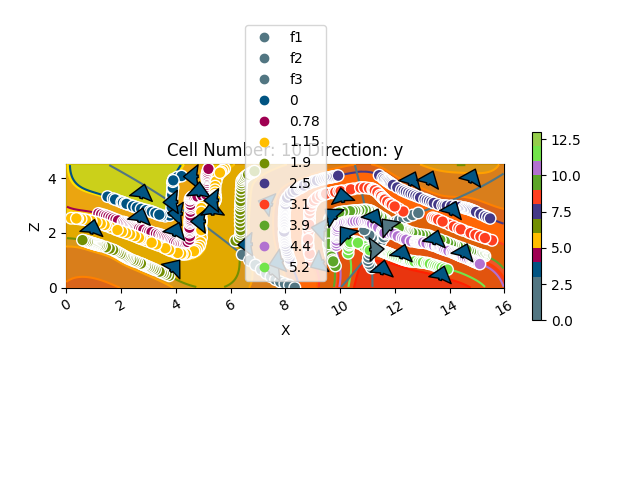
<gempy_viewer.modules.plot_2d.visualization_2d.Plot2D object at 0x7f57ec7a5ed0>
gpv.plot_2d(geo_model, cell_number=[10], show_data=True)
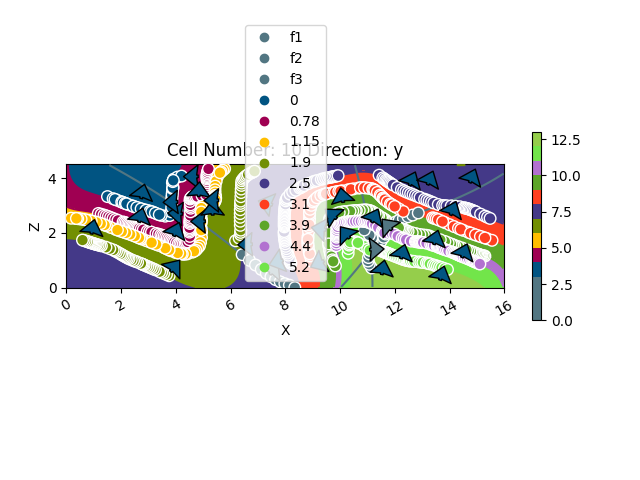
<gempy_viewer.modules.plot_2d.visualization_2d.Plot2D object at 0x7f57783b6f50>
gpv.plot_2d(geo_model, section_names=['section'], show_data=True)
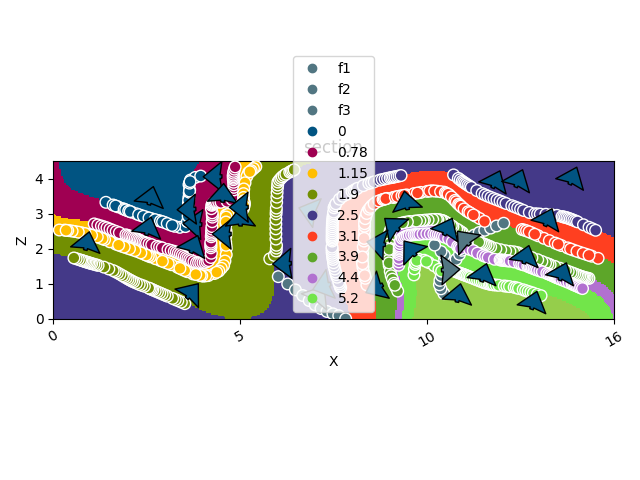
<gempy_viewer.modules.plot_2d.visualization_2d.Plot2D object at 0x7f5782d9c850>
sphinx_gallery_thumbnail_number = 3
gpv.plot_3d(geo_model, kwargs_plot_structured_grid={'opacity': .2})
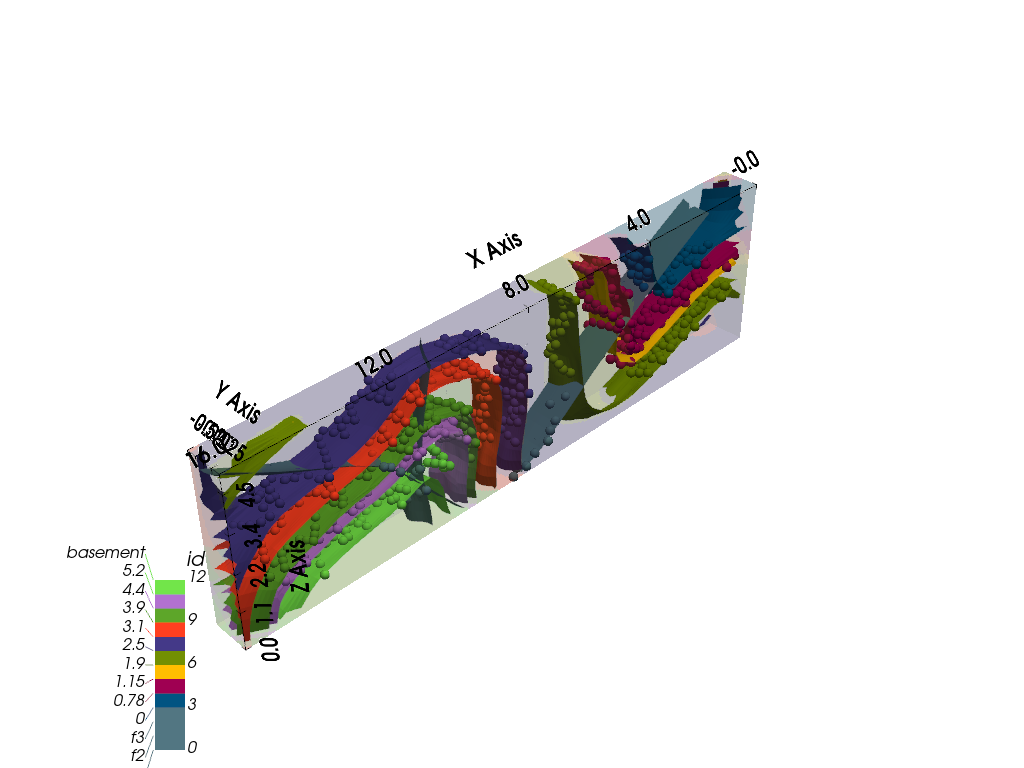
<gempy_viewer.modules.plot_3d.vista.GemPyToVista object at 0x7f577809c590>
Total running time of the script: (0 minutes 27.182 seconds)
