Note
Go to the end to download the full example code.
Model of Ales, France: Plotting Sections and Maps
Explanation
This model is generally quite unstable and requires float64 precision to determine a solution. The lack of data in one corner for the TRIAS and LIAS series causes the model to bend unrealistically, eroding the CARBO layer, which disappears in that section.
import gempy as gp
import gempy_viewer as gpv
import os
Setting up paths
cwd = os.getcwd()
data_path = os.path.join(cwd, 'examples') if 'examples' not in cwd else os.path.join(cwd, '../..')

path_interf = os.path.join(data_path, "data/input_data/AlesModel/2018_interf.csv")
path_orient = os.path.join(data_path, "data/input_data/AlesModel/2018_orient_clust_n_init5_0.csv")
path_dem = os.path.join(data_path, "data/input_data/AlesModel/_cropped_DEM_coarse.tif")
Creating the geological model
geo_model: gp.data.GeoModel = gp.create_geomodel(
    project_name='Claudius',
    extent=[729550.0, 751500.0, 1913500.0, 1923650.0, -1800.0, 800.0],
    resolution=None,
    refinement=6,
    importer_helper=gp.data.ImporterHelper(
        path_to_orientations=path_orient,
        path_to_surface_points=path_interf,
    )
)
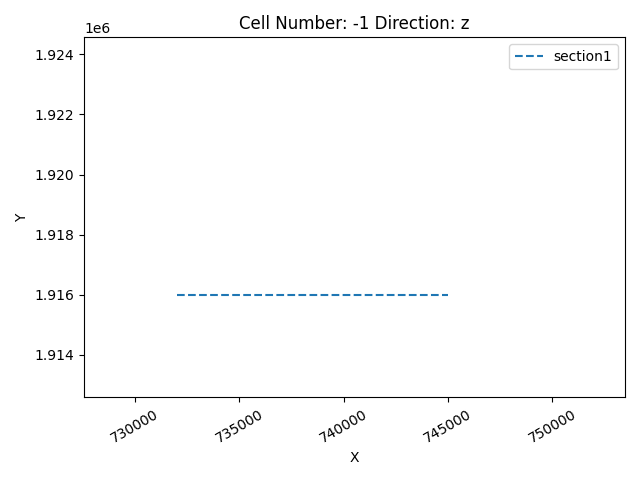
Setting up the section grid
gp.set_section_grid(
    grid=geo_model.grid,
    section_dict={
            'section1': ([732000, 1916000], [745000, 1916000], [200, 150])
    }
)
Active grids: GridTypes.OCTREE|SECTIONS|NONE
Sorting lithologies
gp.map_stack_to_surfaces(
    gempy_model=geo_model,
    mapping_object={
            'fault_left': 'fault_left',
            'fault_right': 'fault_right',
            'fault_lr': 'fault_lr',
            'Trias_Series': ('TRIAS', 'LIAS'),
            'Carbon_Series': 'CARBO',
            'Basement_Series': 'basement'
    },
    remove_unused_series=True
)
Could not find element 'basement' in any group.
Changing colors
geo_model.structural_frame.get_element_by_name("LIAS").color = "#015482"
geo_model.structural_frame.get_element_by_name("TRIAS").color = "#9f0052"
geo_model.structural_frame.get_element_by_name("CARBO").color = "#ffbe00"
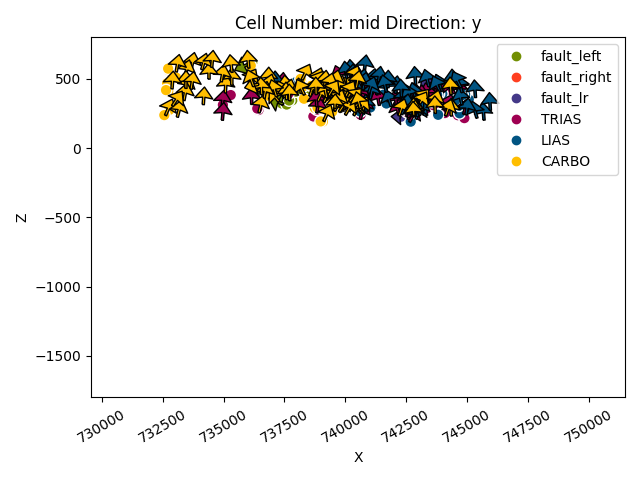
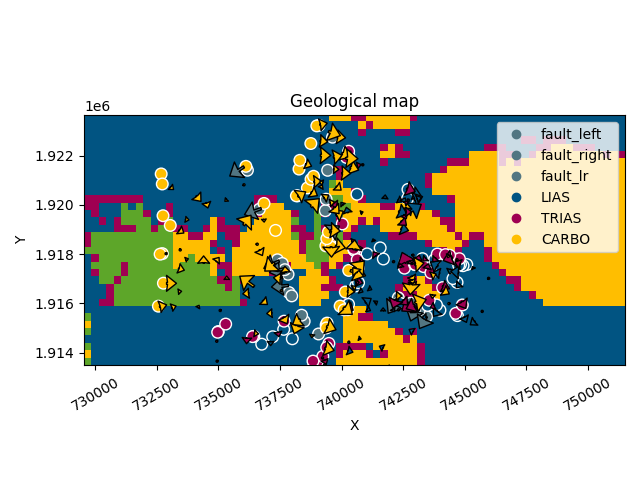
Plotting the 2D model
gpv.plot_2d(geo_model, direction='y')
<gempy_viewer.modules.plot_2d.visualization_2d.Plot2D object at 0x7f577872c850>
Plotting section traces
gpv.plot_section_traces(geo_model)
<function plot_section_traces at 0x7f582f2ef8a0>
Setting faults
gp.set_is_fault(
    frame=geo_model.structural_frame,
    fault_groups=[
            geo_model.structural_frame.get_group_by_name('fault_left'),
            geo_model.structural_frame.get_group_by_name('fault_right'),
            geo_model.structural_frame.get_group_by_name('fault_lr')
    ],
    change_color=True
)
Setting topography from file
gp.set_topography_from_file(
grid=geo_model.grid,
filepath=path_dem,
crop_to_extent=[729550.0, 751500.0, 1913500.0, 1923650.0]
)
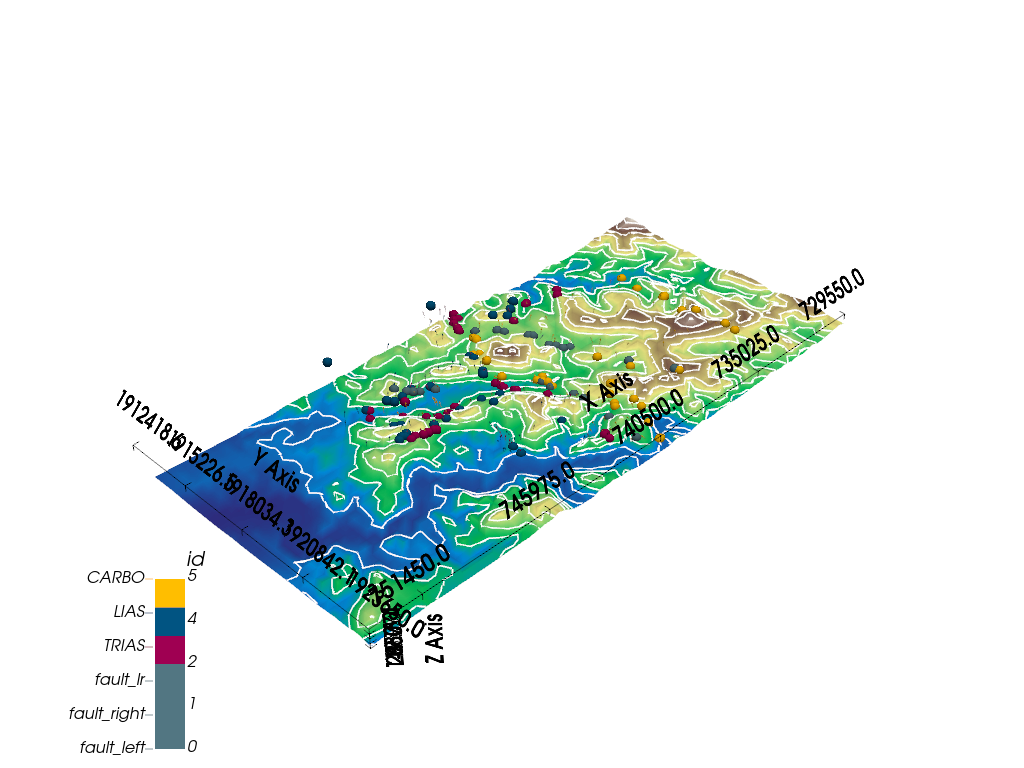
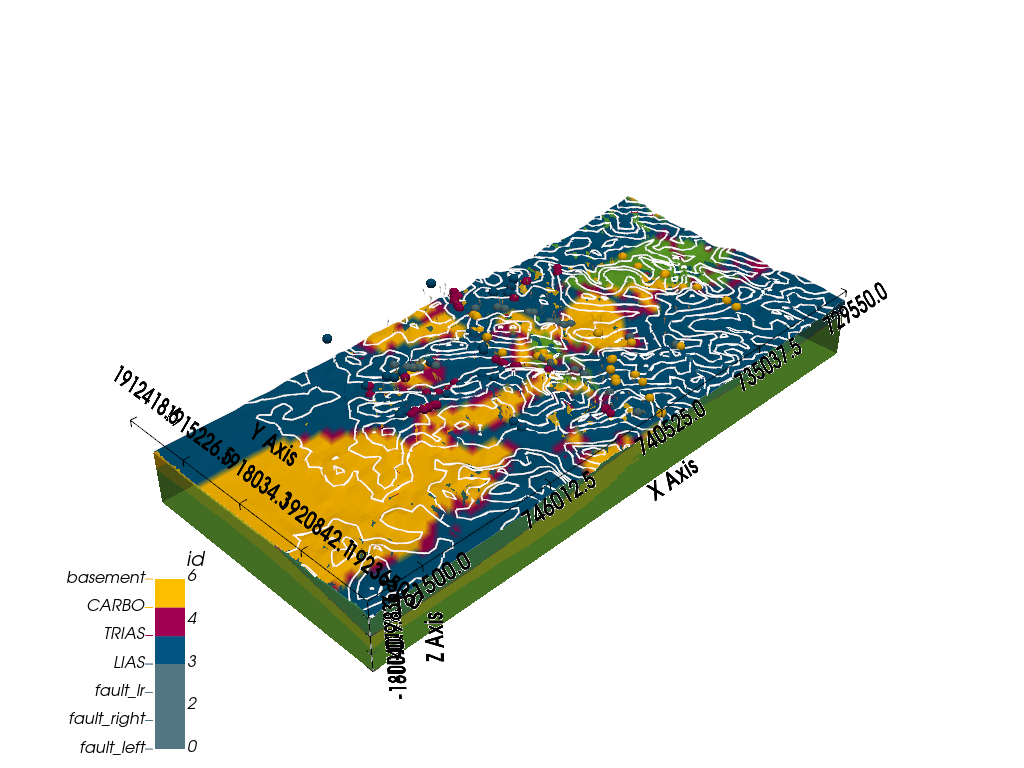
# Plotting 3D model with topography
gpv.plot_3d(geo_model, show_topography=True, ve=1, image=True)
Active grids: GridTypes.OCTREE|TOPOGRAPHY|SECTIONS|NONE

<gempy_viewer.modules.plot_3d.vista.GemPyToVista object at 0x7f5778378590>
Getting the Carbon Series
carbo = geo_model.structural_frame.get_group_by_name("Carbon_Series")
Modifying interpolation options for better model fitting
geo_model.interpolation_options.number_octree_levels_surface = 4
geo_model.interpolation_options.kernel_options.range = 0.8
gp.modify_surface_points(
    geo_model=geo_model,
    elements_names=["CARBO", "LIAS", "TRIAS"],
    nugget=0.005
)
Displaying the structural frame
StructuralFrame(
        structural_groups=[
StructuralGroup(
        name=fault_left,
        structural_relation=StackRelationType.FAULT,
        elements=[
Element(
        name=fault_left,
        color=#527682,
        is_active=True
)
]
),
StructuralGroup(
        name=fault_right,
        structural_relation=StackRelationType.FAULT,
        elements=[
Element(
        name=fault_right,
        color=#527682,
        is_active=True
)
]
),
StructuralGroup(
        name=fault_lr,
        structural_relation=StackRelationType.FAULT,
        elements=[
Element(
        name=fault_lr,
        color=#527682,
        is_active=True
)
]
),
StructuralGroup(
        name=Trias_Series,
        structural_relation=StackRelationType.ERODE,
        elements=[
Element(
        name=TRIAS,
        color=#9f0052,
        is_active=True
),
Element(
        name=LIAS,
        color=#015482,
        is_active=True
)
]
),
StructuralGroup(
        name=Carbon_Series,
        structural_relation=StackRelationType.ERODE,
        elements=[
Element(
        name=CARBO,
        color=#ffbe00,
        is_active=True
)
]
)
],
        fault_relations=
[[False, False, False,  True,  True],
 [False, False, False,  True,  True],
 [False, False, False,  True,  True],
 [False, False, False, False, False],
 [False, False, False, False, False]],
Explanation of model characteristics and adjustments This model has characteristics that make it difficult to get the right default values: - It is large, and we want high resolution - Some series have a large conditional number (i.e., the model input is not very stable) To address these issues: - Reduce the chunk size during evaluation to trade speed for memory - Reduce the std of the error parameter in octree refinement, which evaluates fewer voxels but may leave some without refinement Enable debugging options to help tune these parameters.
Setting verbose and condition number options for debugging
Observations and parameter adjustments The octree refinement is making the octree grid almost dense, and smaller chunks are needed to avoid running out of memory. Adjusting parameters accordingly:
Computing the model with the adjusted settings
geo_model.interpolation_options.mesh_extraction = False
_ = gp.compute_model(
    geo_model,
    engine_config=gp.data.GemPyEngineConfig(
        backend=gp.data.AvailableBackends.PYTORCH,
        use_gpu=True,
        dtype="float64"
    )
)
Setting Backend To: AvailableBackends.PYTORCH
GPU requested but unavailable; falling back to CPU (GEMPY_GPU_FALLBACK=True)
Setting Backend To: AvailableBackends.PYTORCH
Condition number: 2917573.741854929.
Chunking done: 20 chunks
Condition number: 1174481.198953685.
Chunking done: 10 chunks
Condition number: 1642063.3120270486.
Chunking done: 12 chunks
Condition number: 1586673.951914971.
Chunking done: 265 chunks
Condition number: 1122611.6721622644.
Chunking done: 212 chunks
Chunking done: 11 chunks
Chunking done: 6 chunks
Chunking done: 141 chunks
Chunking done: 113 chunks
Chunking done: 83 chunks
Chunking done: 39 chunks
Chunking done: 48 chunks
Chunking done: 1119 chunks
Chunking done: 895 chunks
Chunking done: 220 chunks
Chunking done: 102 chunks
Chunking done: 126 chunks
Chunking done: 2967 chunks
Chunking done: 2374 chunks
Chunking done: 964 chunks
Chunking done: 448 chunks
Chunking done: 551 chunks
Chunking done: 13033 chunks
Chunking done: 10427 chunks
Chunking done: 485 chunks
Chunking done: 225 chunks
Chunking done: 277 chunks
Chunking done: 6546 chunks
Chunking done: 5237 chunks
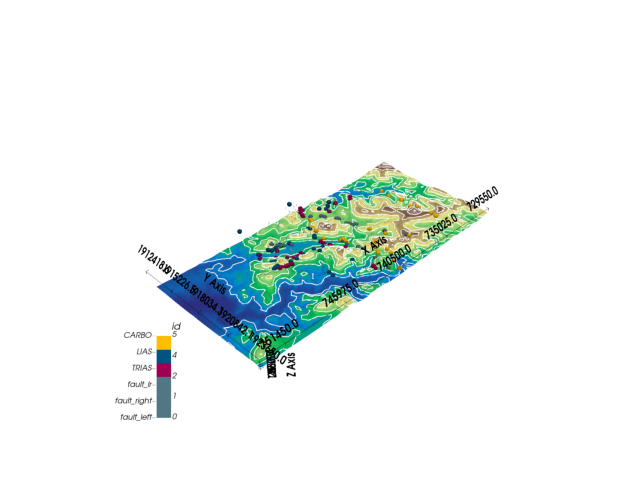
Plotting the 2D model with and without topography
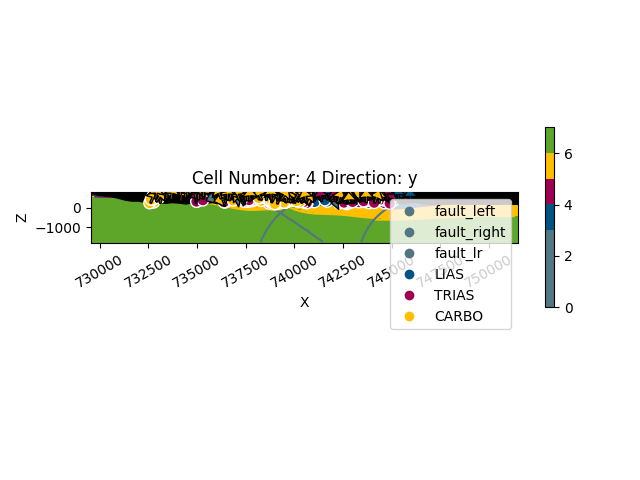
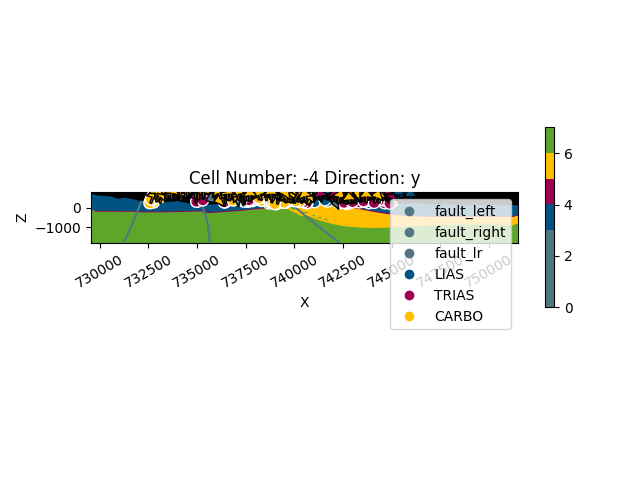
<gempy_viewer.modules.plot_2d.visualization_2d.Plot2D object at 0x7f57bff681d0>
Setting thumbnail number for Sphinx-Gallery sphinx_gallery_thumbnail_number = -1
gpv.plot_3d(geo_model, show_lith=True, show_topography=True, kwargs_plot_structured_grid={'opacity': 0.8})
<gempy_viewer.modules.plot_3d.vista.GemPyToVista object at 0x7f57780c0e50>
Total running time of the script: (4 minutes 37.155 seconds)
