Note
Click here to download the full example code
Model 5 - Fault
A simple fault model with constant offset. We start by importing the necessary dependencies:
Importing GemPy
import gempy as gp

import pandas as pd
pd.set_option('precision', 2)
Creating the model by importing the input data and displaying it:
data_path = 'https://raw.githubusercontent.com/cgre-aachen/gempy_data/master/'
path_to_data = data_path + "/data/input_data/jan_models/"

geo_data = gp.create_data('fault', extent=[0, 1000, 0, 1000, 0, 1000], resolution=[50, 50, 50],
                          path_o=path_to_data + "model5_orientations.csv",
                          path_i=path_to_data + "model5_surface_points.csv")
Out:
Active grids: ['regular']
Setting and ordering the units and series:
gp.map_stack_to_surfaces(geo_data, {"Fault_Series": 'fault',
                                    "Strat_Series": ('rock2', 'rock1')})
geo_data.set_is_fault(['Fault_Series'])
Out:
Fault colors changed. If you do not like this behavior, set change_color to False.
gp.plot_2d(geo_data, direction='y')
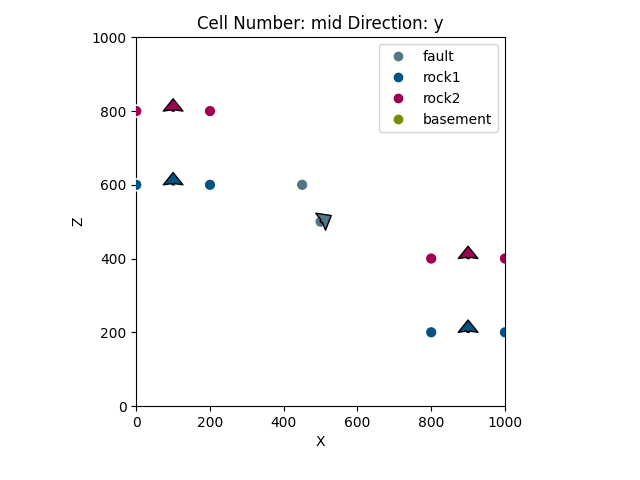
Out:
<gempy.plot.visualization_2d.Plot2D object at 0x7fcc6bb43b20>
Calculating the model:
interp_data = gp.set_interpolator(geo_data, theano_optimizer='fast_compile')
Out:
Setting kriging parameters to their default values.
Compiling theano function...
Level of Optimization:  fast_compile
Device:  cpu
Precision:  float64
Number of faults:  1
Compilation Done!
Kriging values:
                     values
range              1732.05
$C_o$             71428.57
drift equations  [3, 3, 3]
Displaying the result in x and y direction:
sphinx_gallery_thumbnail_number = 2
gp.plot_2d(geo_data, cell_number=25,
           direction='y', show_data=False, show_all_data=True)
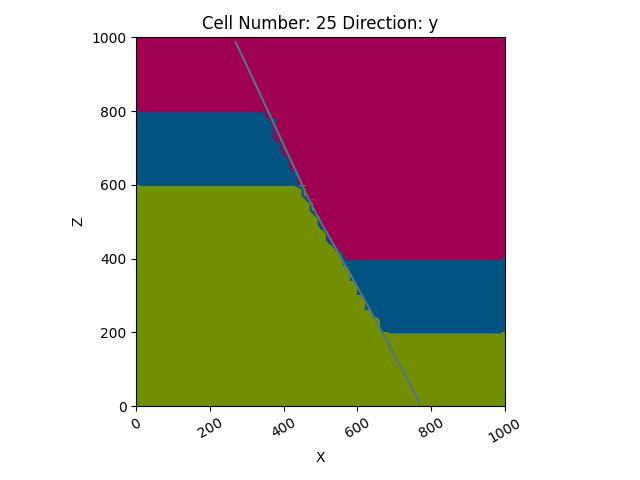
Out:
<gempy.plot.visualization_2d.Plot2D object at 0x7fcc3012afa0>
gp.plot_2d(geo_data, cell_number=25,
           direction='x', show_data=True)
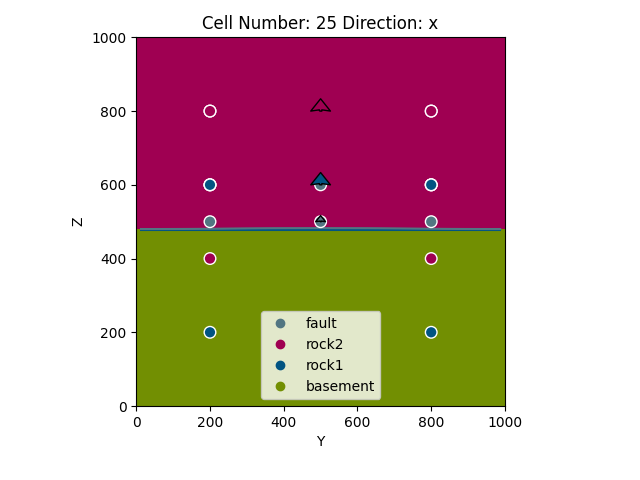
Out:
<gempy.plot.visualization_2d.Plot2D object at 0x7fcc6bb43be0>
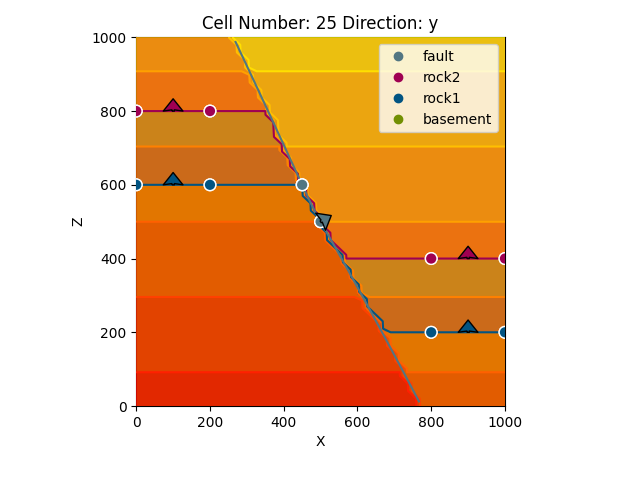
gp.plot_2d(geo_data, cell_number=25,
           direction='y', show_data=True, show_scalar=True, series_n=1)


gp.save_model(geo_data)
Out:
True
Total running time of the script: ( 0 minutes 5.479 seconds)

