Note
Go to the end to download the full example code.
1.3c: Adding topography to geological models
import gempy as gp
import gempy_viewer as gpv
import numpy as np
import os
1. The common procedure to set up a model:
data_path = os.path.abspath('../../')

geo_model: gp.data.GeoModel = gp.create_geomodel(
    project_name='Single_layer_topo',
    extent=[450000, 460000, 70000, 80000, -1000, 500],
    resolution=[50, 50, 50],
    refinement=4,
    importer_helper=gp.data.ImporterHelper(
        path_to_orientations=data_path + "/data/input_data/tut-ch1-7/onelayer_orient.csv",
        path_to_surface_points=data_path + "/data/input_data/tut-ch1-7/onelayer_interfaces.csv",
    )
)
gp.set_section_grid(
    grid=geo_model.grid,
    section_dict={
        'section1': ([450000, 75000], [460000, 75500], [100, 100]),
    }
)
Active grids: GridTypes.DENSE|SECTIONS|NONE
2. Adding topography
2 a. Load from raster file
Coming soon: Importing raster data
This feature is not yet available in the current version of GemPy. Probably will be moved to subsurface since coupling it with the geological model does not add much value.
%%
# This is to make it work in sphinx gallery
# cwd = os.getcwd()
# if not 'examples' in cwd:
#     path_dir = os.getcwd() + '/examples/tutorials/ch5_probabilistic_modeling'
# else:
#     path_dir = cwd
#
# fp = path_dir + "/../../data/input_data/tut-ch1-7/bogota.tif"
#
# # %%
# geo_model.set_topography(source='gdal', filepath=fp)
# gp.plot_2d(geo_model, show_topography=True, section_names=['topography'], show_lith=False,
#            show_boundaries=False,
#            kwargs_topography={'cmap': 'gray', 'norm': None}
#            )
# plt.show()
2 b. create fun topography
If there is no topography file, but you think that your model with
topography would look significantly cooler, you can use gempys
set_topography function
to generate a random topography based on a fractal grid:
sphinx_gallery_thumbnail_number = 2
gp.set_topography_from_random(grid=geo_model.grid)
gpv.plot_2d(geo_model, show_topography=True, section_names=['topography'])
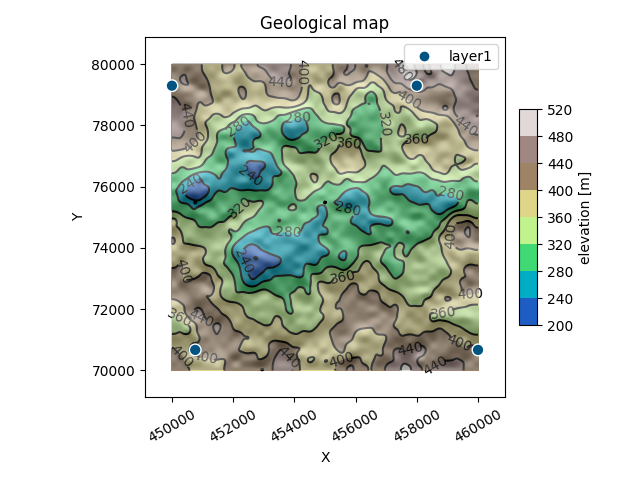
[200. 500.]
Active grids: GridTypes.DENSE|TOPOGRAPHY|SECTIONS|NONE

<gempy_viewer.modules.plot_2d.visualization_2d.Plot2D object at 0x7f5820e76bd0>
It has additional keywords to play around with:
- fd: fractal dimension:
defaults to 2.0. The higher (try 2.9), the rougher the landscape will be.
- d_z: height difference:
If none, last 20% of the model in z direction.
- extent:
extent in xy direction. If none,
geo_model.grid.extentis used.
- resolution:
resolution of the topography array. If none,
geo_model.grid.resoutionis used. Increasing the resolution leads to much nicer geological maps!
gp.set_topography_from_random(
    grid=geo_model.grid,
    fractal_dimension=1.9,
    d_z=np.array([0, 250]),
    topography_resolution=np.array([200, 200])
)
Active grids: GridTypes.DENSE|TOPOGRAPHY|SECTIONS|NONE

Topography(_regular_grid=RegularGrid(resolution=array([50, 50, 50]), extent=array([450000., 460000.,  70000.,  80000.,  -1000.,    500.]), values=array([[ 4.501e+05,  7.010e+04, -9.850e+02],
       [ 4.501e+05,  7.010e+04, -9.550e+02],
       [ 4.501e+05,  7.010e+04, -9.250e+02],
       ...,
       [ 4.599e+05,  7.990e+04,  4.250e+02],
       [ 4.599e+05,  7.990e+04,  4.550e+02],
       [ 4.599e+05,  7.990e+04,  4.850e+02]], shape=(125000, 3)), mask_topo=array([], shape=(0, 3), dtype=bool), _transform=None, _base_resolution=array([2, 2, 2])), values_2d=array([[[4.50000000e+05, 7.00000000e+04, 7.34596488e+01],
        [4.50000000e+05, 7.00502513e+04, 7.45243395e+01],
        [4.50000000e+05, 7.01005025e+04, 7.40537449e+01],
        ...,
        [4.50000000e+05, 7.98994975e+04, 7.17858616e+01],
        [4.50000000e+05, 7.99497487e+04, 7.21180006e+01],
        [4.50000000e+05, 8.00000000e+04, 7.18977366e+01]],

       [[4.50050251e+05, 7.00000000e+04, 7.41301941e+01],
        [4.50050251e+05, 7.00502513e+04, 7.57891579e+01],
        [4.50050251e+05, 7.01005025e+04, 7.58128020e+01],
        ...,
        [4.50050251e+05, 7.98994975e+04, 7.22948908e+01],
        [4.50050251e+05, 7.99497487e+04, 7.24550446e+01],
        [4.50050251e+05, 8.00000000e+04, 7.27198137e+01]],

       [[4.50100503e+05, 7.00000000e+04, 7.70047586e+01],
        [4.50100503e+05, 7.00502513e+04, 7.85454213e+01],
        [4.50100503e+05, 7.01005025e+04, 7.88053122e+01],
        ...,
        [4.50100503e+05, 7.98994975e+04, 7.56069209e+01],
        [4.50100503e+05, 7.99497487e+04, 7.45485308e+01],
        [4.50100503e+05, 8.00000000e+04, 7.53339520e+01]],

       ...,

       [[4.59899497e+05, 7.00000000e+04, 7.03945990e+01],
        [4.59899497e+05, 7.00502513e+04, 7.09087868e+01],
        [4.59899497e+05, 7.01005025e+04, 6.98478265e+01],
        ...,
        [4.59899497e+05, 7.98994975e+04, 6.96395575e+01],
        [4.59899497e+05, 7.99497487e+04, 6.99895606e+01],
        [4.59899497e+05, 8.00000000e+04, 7.07340380e+01]],

       [[4.59949749e+05, 7.00000000e+04, 7.19215392e+01],
        [4.59949749e+05, 7.00502513e+04, 7.19567409e+01],
        [4.59949749e+05, 7.01005025e+04, 7.00610252e+01],
        ...,
        [4.59949749e+05, 7.98994975e+04, 6.93208833e+01],
        [4.59949749e+05, 7.99497487e+04, 7.05315350e+01],
        [4.59949749e+05, 8.00000000e+04, 7.12593460e+01]],

       [[4.60000000e+05, 7.00000000e+04, 7.31063746e+01],
        [4.60000000e+05, 7.00502513e+04, 7.29276832e+01],
        [4.60000000e+05, 7.01005025e+04, 7.20995963e+01],
        ...,
        [4.60000000e+05, 7.98994975e+04, 7.02957350e+01],
        [4.60000000e+05, 7.99497487e+04, 7.17424679e+01],
        [4.60000000e+05, 8.00000000e+04, 7.15484525e+01]]],
      shape=(200, 200, 3)), source=None, values=array([[4.50000000e+05, 7.00000000e+04, 7.34596488e+01],
       [4.50000000e+05, 7.00502513e+04, 7.45243395e+01],
       [4.50000000e+05, 7.01005025e+04, 7.40537449e+01],
       ...,
       [4.60000000e+05, 7.98994975e+04, 7.02957350e+01],
       [4.60000000e+05, 7.99497487e+04, 7.17424679e+01],
       [4.60000000e+05, 8.00000000e+04, 7.15484525e+01]], shape=(40000, 3)), resolution=(200, 200), raster_shape=())
Compute model
Setting Backend To: AvailableBackends.PYTORCH
GPU requested but unavailable; falling back to CPU (GEMPY_GPU_FALLBACK=True)
Setting Backend To: AvailableBackends.PYTORCH
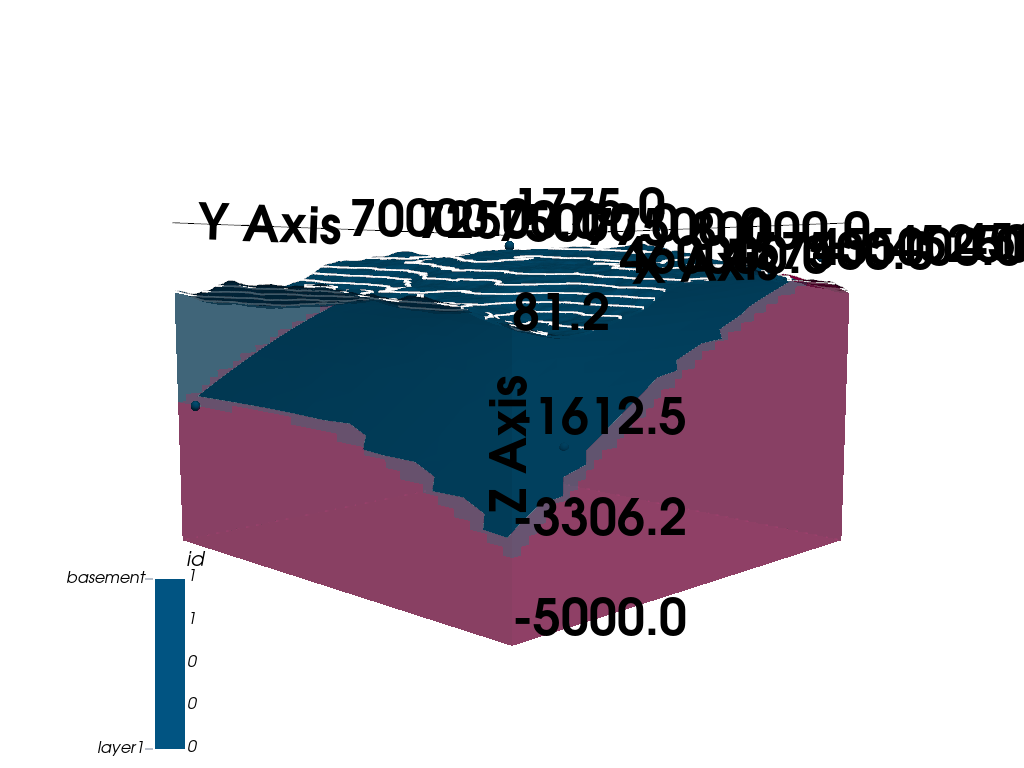
Visualize:
Now, the solutions object does also contain the computed geological map. It can be visualized using the 2D and 3D plotting functionality:
gpv.plot_2d(geo_model, show_topography=True, section_names=['topography'], show_boundaries=False, show_data=True)
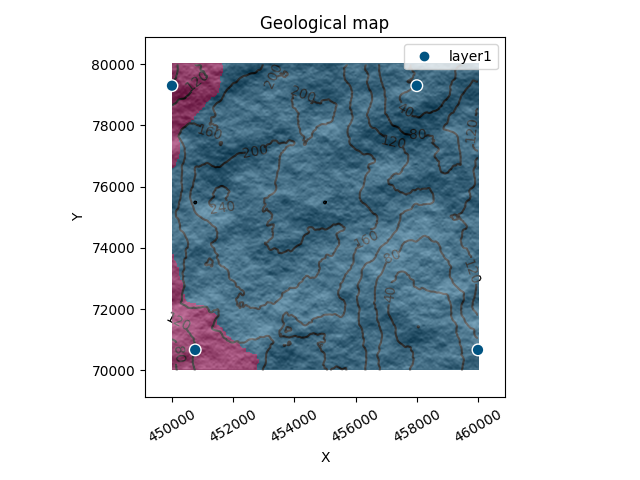
<gempy_viewer.modules.plot_2d.visualization_2d.Plot2D object at 0x7f57ec7a4e50>
gpv.plot_2d(geo_model, show_topography=True, section_names=['section1'])
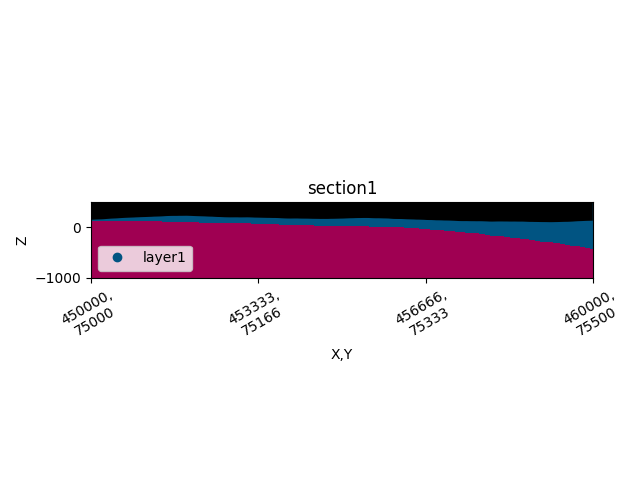
/opt/buildAgent/work/3a8738c25f60c3c9/venv/lib/python3.14/site-packages/gempy_viewer/API/_plot_2d_sections_api.py:112: UserWarning: Section contacts not implemented yet. We need to pass scalar field for the sections grid
  warnings.warn(

<gempy_viewer.modules.plot_2d.visualization_2d.Plot2D object at 0x7f582169c250>
g3d = gpv.plot_3d(
    model=geo_model,
    show_topography=True,
    show_lith=False,
    show_surfaces=False,
    show_results=False,
    ve=5
)
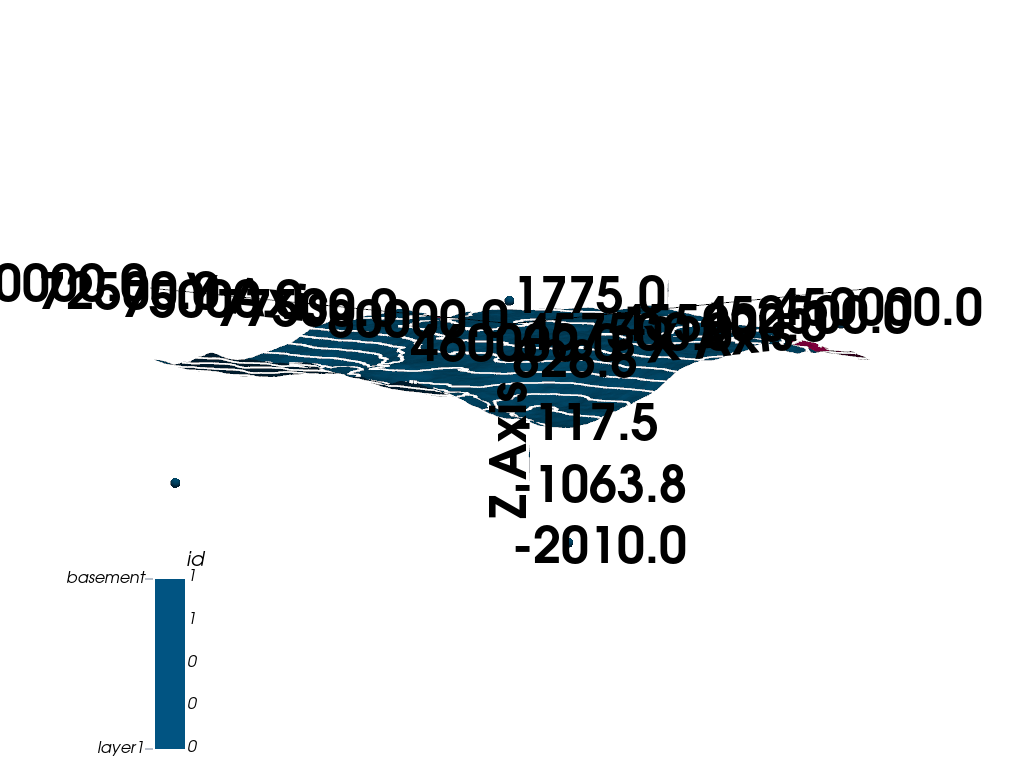
sphinx_gallery_thumbnail_number = 3
g3d = gpv.plot_3d(
    model=geo_model,
    show_topography=True,
    show_lith=True,
    show_surfaces=True,
    ve=5
)
Total running time of the script: (0 minutes 5.571 seconds)
