Note
Go to the end to download the full example code.
1.6: 2D Visualization.
import os

# Importing auxiliary libraries
import numpy as np

# Importing GemPy
import gempy as gp
import gempy_viewer as gpv

# sphinx_gallery_thumbnail_number = -1

np.random.seed(1515)
Model interpolation
Data Preparation
data_path = os.path.abspath('../../')

geo_data: gp.data.GeoModel = gp.create_geomodel(
    project_name='viz_2d',
    extent=[0, 1000, 0, 1000, 0, 1000],
    resolution=[10, 10, 10],
    refinement=4,
    importer_helper=gp.data.ImporterHelper(
        path_to_orientations=data_path + "/data/input_data/jan_models/model5_orientations.csv",
        path_to_surface_points=data_path + "/data/input_data/jan_models/model5_surface_points.csv",
    )
)

gp.set_topography_from_random(grid=geo_data.grid, d_z=np.array([500, 1000]))
Active grids: GridTypes.DENSE|TOPOGRAPHY|NONE

Topography(_regular_grid=RegularGrid(resolution=array([10, 10, 10]), extent=array([   0., 1000.,    0., 1000.,    0., 1000.]), values=array([[ 50.,  50.,  50.],
       [ 50.,  50., 150.],
       [ 50.,  50., 250.],
       ...,
       [950., 950., 750.],
       [950., 950., 850.],
       [950., 950., 950.]], shape=(1000, 3)), mask_topo=array([], shape=(0, 3), dtype=bool), _transform=None, _base_resolution=array([2, 2, 2])), values_2d=array([[[   0.        ,    0.        ,  562.41208325],
        [   0.        ,  111.11111111,  678.69144966],
        [   0.        ,  222.22222222,  814.76576506],
        [   0.        ,  333.33333333,  787.73148507],
        [   0.        ,  444.44444444,  679.46990324],
        [   0.        ,  555.55555556,  610.52262081],
        [   0.        ,  666.66666667,  695.60132872],
        [   0.        ,  777.77777778,  643.1752034 ],
        [   0.        ,  888.88888889,  547.94484015],
        [   0.        , 1000.        ,  500.        ]],

       [[ 111.11111111,    0.        ,  552.05957979],
        [ 111.11111111,  111.11111111,  671.70334601],
        [ 111.11111111,  222.22222222,  785.77377111],
        [ 111.11111111,  333.33333333,  802.64722478],
        [ 111.11111111,  444.44444444,  735.40066449],
        [ 111.11111111,  555.55555556,  697.51403744],
        [ 111.11111111,  666.66666667,  724.67190256],
        [ 111.11111111,  777.77777778,  671.95824233],
        [ 111.11111111,  888.88888889,  610.84270945],
        [ 111.11111111, 1000.        ,  561.26041198]],

       [[ 222.22222222,    0.        ,  628.32630052],
        [ 222.22222222,  111.11111111,  655.12733102],
        [ 222.22222222,  222.22222222,  800.25056852],
        [ 222.22222222,  333.33333333,  872.05988921],
        [ 222.22222222,  444.44444444,  730.74536298],
        [ 222.22222222,  555.55555556,  689.49803472],
        [ 222.22222222,  666.66666667,  740.88594247],
        [ 222.22222222,  777.77777778,  779.46281932],
        [ 222.22222222,  888.88888889,  747.93043419],
        [ 222.22222222, 1000.        ,  695.35081617]],

       [[ 333.33333333,    0.        ,  776.48537366],
        [ 333.33333333,  111.11111111,  824.43440341],
        [ 333.33333333,  222.22222222,  833.43146864],
        [ 333.33333333,  333.33333333,  782.65097753],
        [ 333.33333333,  444.44444444,  703.61068892],
        [ 333.33333333,  555.55555556,  750.18348023],
        [ 333.33333333,  666.66666667,  838.81325666],
        [ 333.33333333,  777.77777778,  824.03364784],
        [ 333.33333333,  888.88888889,  841.74272328],
        [ 333.33333333, 1000.        ,  815.3840938 ]],

       [[ 444.44444444,    0.        ,  810.72948763],
        [ 444.44444444,  111.11111111,  814.43232454],
        [ 444.44444444,  222.22222222,  840.28281595],
        [ 444.44444444,  333.33333333,  750.71078299],
        [ 444.44444444,  444.44444444,  688.13033779],
        [ 444.44444444,  555.55555556,  702.82847883],
        [ 444.44444444,  666.66666667,  843.78229982],
        [ 444.44444444,  777.77777778,  946.96204174],
        [ 444.44444444,  888.88888889,  970.51876294],
        [ 444.44444444, 1000.        ,  872.33921496]],

       [[ 555.55555556,    0.        ,  849.19752939],
        [ 555.55555556,  111.11111111,  801.56643377],
        [ 555.55555556,  222.22222222,  779.95724838],
        [ 555.55555556,  333.33333333,  687.02591662],
        [ 555.55555556,  444.44444444,  664.54767165],
        [ 555.55555556,  555.55555556,  629.08043705],
        [ 555.55555556,  666.66666667,  736.10737926],
        [ 555.55555556,  777.77777778,  893.6966546 ],
        [ 555.55555556,  888.88888889, 1000.        ],
        [ 555.55555556, 1000.        ,  917.72473865]],

       [[ 666.66666667,    0.        ,  792.72473531],
        [ 666.66666667,  111.11111111,  780.86685735],
        [ 666.66666667,  222.22222222,  756.46511588],
        [ 666.66666667,  333.33333333,  767.04155033],
        [ 666.66666667,  444.44444444,  765.88329794],
        [ 666.66666667,  555.55555556,  698.37639498],
        [ 666.66666667,  666.66666667,  753.72835104],
        [ 666.66666667,  777.77777778,  817.31176033],
        [ 666.66666667,  888.88888889,  857.50999971],
        [ 666.66666667, 1000.        ,  813.32887336]],

       [[ 777.77777778,    0.        ,  655.83199406],
        [ 777.77777778,  111.11111111,  728.28158144],
        [ 777.77777778,  222.22222222,  742.26560642],
        [ 777.77777778,  333.33333333,  798.30982799],
        [ 777.77777778,  444.44444444,  724.35800641],
        [ 777.77777778,  555.55555556,  664.27600056],
        [ 777.77777778,  666.66666667,  708.60897142],
        [ 777.77777778,  777.77777778,  760.57446696],
        [ 777.77777778,  888.88888889,  736.98920937],
        [ 777.77777778, 1000.        ,  668.1727696 ]],

       [[ 888.88888889,    0.        ,  563.87411417],
        [ 888.88888889,  111.11111111,  658.36823572],
        [ 888.88888889,  222.22222222,  656.25213608],
        [ 888.88888889,  333.33333333,  719.36180396],
        [ 888.88888889,  444.44444444,  663.39848835],
        [ 888.88888889,  555.55555556,  585.81630235],
        [ 888.88888889,  666.66666667,  612.90684545],
        [ 888.88888889,  777.77777778,  667.7142797 ],
        [ 888.88888889,  888.88888889,  596.29762272],
        [ 888.88888889, 1000.        ,  608.98292345]],

       [[1000.        ,    0.        ,  542.65006454],
        [1000.        ,  111.11111111,  623.27972   ],
        [1000.        ,  222.22222222,  638.05439543],
        [1000.        ,  333.33333333,  705.15596849],
        [1000.        ,  444.44444444,  686.76128672],
        [1000.        ,  555.55555556,  649.41337999],
        [1000.        ,  666.66666667,  639.82329336],
        [1000.        ,  777.77777778,  601.70645773],
        [1000.        ,  888.88888889,  547.79987061],
        [1000.        , 1000.        ,  531.67197073]]]), source=None, values=array([[   0.        ,    0.        ,  562.41208325],
       [   0.        ,  111.11111111,  678.69144966],
       [   0.        ,  222.22222222,  814.76576506],
       [   0.        ,  333.33333333,  787.73148507],
       [   0.        ,  444.44444444,  679.46990324],
       [   0.        ,  555.55555556,  610.52262081],
       [   0.        ,  666.66666667,  695.60132872],
       [   0.        ,  777.77777778,  643.1752034 ],
       [   0.        ,  888.88888889,  547.94484015],
       [   0.        , 1000.        ,  500.        ],
       [ 111.11111111,    0.        ,  552.05957979],
       [ 111.11111111,  111.11111111,  671.70334601],
       [ 111.11111111,  222.22222222,  785.77377111],
       [ 111.11111111,  333.33333333,  802.64722478],
       [ 111.11111111,  444.44444444,  735.40066449],
       [ 111.11111111,  555.55555556,  697.51403744],
       [ 111.11111111,  666.66666667,  724.67190256],
       [ 111.11111111,  777.77777778,  671.95824233],
       [ 111.11111111,  888.88888889,  610.84270945],
       [ 111.11111111, 1000.        ,  561.26041198],
       [ 222.22222222,    0.        ,  628.32630052],
       [ 222.22222222,  111.11111111,  655.12733102],
       [ 222.22222222,  222.22222222,  800.25056852],
       [ 222.22222222,  333.33333333,  872.05988921],
       [ 222.22222222,  444.44444444,  730.74536298],
       [ 222.22222222,  555.55555556,  689.49803472],
       [ 222.22222222,  666.66666667,  740.88594247],
       [ 222.22222222,  777.77777778,  779.46281932],
       [ 222.22222222,  888.88888889,  747.93043419],
       [ 222.22222222, 1000.        ,  695.35081617],
       [ 333.33333333,    0.        ,  776.48537366],
       [ 333.33333333,  111.11111111,  824.43440341],
       [ 333.33333333,  222.22222222,  833.43146864],
       [ 333.33333333,  333.33333333,  782.65097753],
       [ 333.33333333,  444.44444444,  703.61068892],
       [ 333.33333333,  555.55555556,  750.18348023],
       [ 333.33333333,  666.66666667,  838.81325666],
       [ 333.33333333,  777.77777778,  824.03364784],
       [ 333.33333333,  888.88888889,  841.74272328],
       [ 333.33333333, 1000.        ,  815.3840938 ],
       [ 444.44444444,    0.        ,  810.72948763],
       [ 444.44444444,  111.11111111,  814.43232454],
       [ 444.44444444,  222.22222222,  840.28281595],
       [ 444.44444444,  333.33333333,  750.71078299],
       [ 444.44444444,  444.44444444,  688.13033779],
       [ 444.44444444,  555.55555556,  702.82847883],
       [ 444.44444444,  666.66666667,  843.78229982],
       [ 444.44444444,  777.77777778,  946.96204174],
       [ 444.44444444,  888.88888889,  970.51876294],
       [ 444.44444444, 1000.        ,  872.33921496],
       [ 555.55555556,    0.        ,  849.19752939],
       [ 555.55555556,  111.11111111,  801.56643377],
       [ 555.55555556,  222.22222222,  779.95724838],
       [ 555.55555556,  333.33333333,  687.02591662],
       [ 555.55555556,  444.44444444,  664.54767165],
       [ 555.55555556,  555.55555556,  629.08043705],
       [ 555.55555556,  666.66666667,  736.10737926],
       [ 555.55555556,  777.77777778,  893.6966546 ],
       [ 555.55555556,  888.88888889, 1000.        ],
       [ 555.55555556, 1000.        ,  917.72473865],
       [ 666.66666667,    0.        ,  792.72473531],
       [ 666.66666667,  111.11111111,  780.86685735],
       [ 666.66666667,  222.22222222,  756.46511588],
       [ 666.66666667,  333.33333333,  767.04155033],
       [ 666.66666667,  444.44444444,  765.88329794],
       [ 666.66666667,  555.55555556,  698.37639498],
       [ 666.66666667,  666.66666667,  753.72835104],
       [ 666.66666667,  777.77777778,  817.31176033],
       [ 666.66666667,  888.88888889,  857.50999971],
       [ 666.66666667, 1000.        ,  813.32887336],
       [ 777.77777778,    0.        ,  655.83199406],
       [ 777.77777778,  111.11111111,  728.28158144],
       [ 777.77777778,  222.22222222,  742.26560642],
       [ 777.77777778,  333.33333333,  798.30982799],
       [ 777.77777778,  444.44444444,  724.35800641],
       [ 777.77777778,  555.55555556,  664.27600056],
       [ 777.77777778,  666.66666667,  708.60897142],
       [ 777.77777778,  777.77777778,  760.57446696],
       [ 777.77777778,  888.88888889,  736.98920937],
       [ 777.77777778, 1000.        ,  668.1727696 ],
       [ 888.88888889,    0.        ,  563.87411417],
       [ 888.88888889,  111.11111111,  658.36823572],
       [ 888.88888889,  222.22222222,  656.25213608],
       [ 888.88888889,  333.33333333,  719.36180396],
       [ 888.88888889,  444.44444444,  663.39848835],
       [ 888.88888889,  555.55555556,  585.81630235],
       [ 888.88888889,  666.66666667,  612.90684545],
       [ 888.88888889,  777.77777778,  667.7142797 ],
       [ 888.88888889,  888.88888889,  596.29762272],
       [ 888.88888889, 1000.        ,  608.98292345],
       [1000.        ,    0.        ,  542.65006454],
       [1000.        ,  111.11111111,  623.27972   ],
       [1000.        ,  222.22222222,  638.05439543],
       [1000.        ,  333.33333333,  705.15596849],
       [1000.        ,  444.44444444,  686.76128672],
       [1000.        ,  555.55555556,  649.41337999],
       [1000.        ,  666.66666667,  639.82329336],
       [1000.        ,  777.77777778,  601.70645773],
       [1000.        ,  888.88888889,  547.79987061],
       [1000.        , 1000.        ,  531.67197073]]), resolution=(10, 10), raster_shape=())
gpv.plot_2d(geo_data)
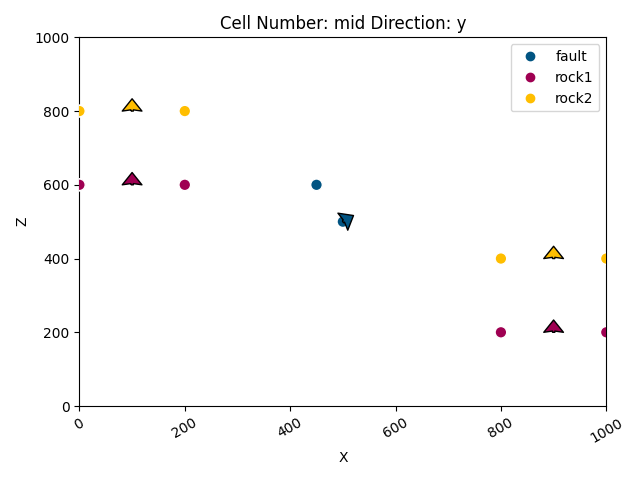
<gempy_viewer.modules.plot_2d.visualization_2d.Plot2D object at 0x7f5820c49050>
section_dict = {'section1': ([0, 0], [1000, 1000], [100, 80]),
                'section2': ([800, 0], [800, 1000], [150, 100]),
                'section3': ([50, 200], [100, 500], [200, 150])}
gp.set_section_grid(geo_data.grid, section_dict)
gpv.plot_section_traces(geo_data)
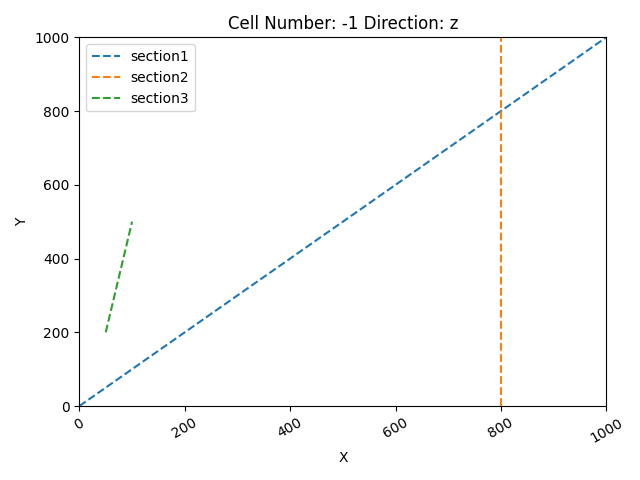
Active grids: GridTypes.DENSE|TOPOGRAPHY|SECTIONS|NONE

<function plot_section_traces at 0x7f582f2ef8a0>
geo_data.grid.sections
gp.map_stack_to_surfaces(
    gempy_model=geo_data,
    mapping_object={
        "Fault_Series": 'fault',
        "Strat_Series": ('rock2', 'rock1')
    }
)

gp.set_is_fault(
    frame=geo_data.structural_frame,
    fault_groups=['Fault_Series']
)
geo_data.grid.active_grids
<GridTypes.DENSE|TOPOGRAPHY|SECTIONS|NONE: 1050>
Setting Backend To: AvailableBackends.PYTORCH
GPU requested but unavailable; falling back to CPU (GEMPY_GPU_FALLBACK=True)
Setting Backend To: AvailableBackends.PYTORCH
new plotting api
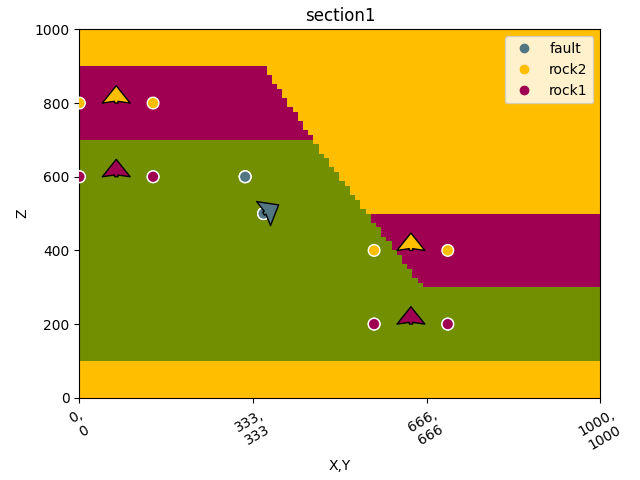
gpv.plot_2d(geo_data, section_names=['section1'])

/opt/buildAgent/work/3a8738c25f60c3c9/venv/lib/python3.14/site-packages/gempy_viewer/API/_plot_2d_sections_api.py:112: UserWarning: Section contacts not implemented yet. We need to pass scalar field for the sections grid
  warnings.warn(

<gempy_viewer.modules.plot_2d.visualization_2d.Plot2D object at 0x7f5821252950>
Plot API
If nothing is passed, a Plot2D object is created and therefore you are in the same situation as above:
p3 = gpv.plot_2d(geo_data)
Alternatively you can pass section_names, cell_numbers + direction or any combination of the above:
gpv.plot_2d(geo_data, section_names=['topography'])
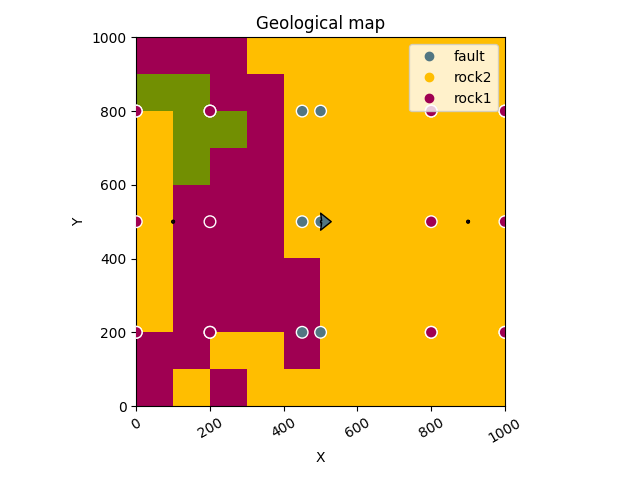
/opt/buildAgent/work/3a8738c25f60c3c9/venv/lib/python3.14/site-packages/gempy_viewer/API/_plot_2d_sections_api.py:112: UserWarning: Section contacts not implemented yet. We need to pass scalar field for the sections grid
  warnings.warn(

<gempy_viewer.modules.plot_2d.visualization_2d.Plot2D object at 0x7f580ed26cd0>
gpv.plot_2d(geo_data, section_names=['section1'])
/opt/buildAgent/work/3a8738c25f60c3c9/venv/lib/python3.14/site-packages/gempy_viewer/API/_plot_2d_sections_api.py:112: UserWarning: Section contacts not implemented yet. We need to pass scalar field for the sections grid
  warnings.warn(

<gempy_viewer.modules.plot_2d.visualization_2d.Plot2D object at 0x7f5820c456d0>
gpv.plot_2d(geo_data, section_names=['section1', 'section2'])
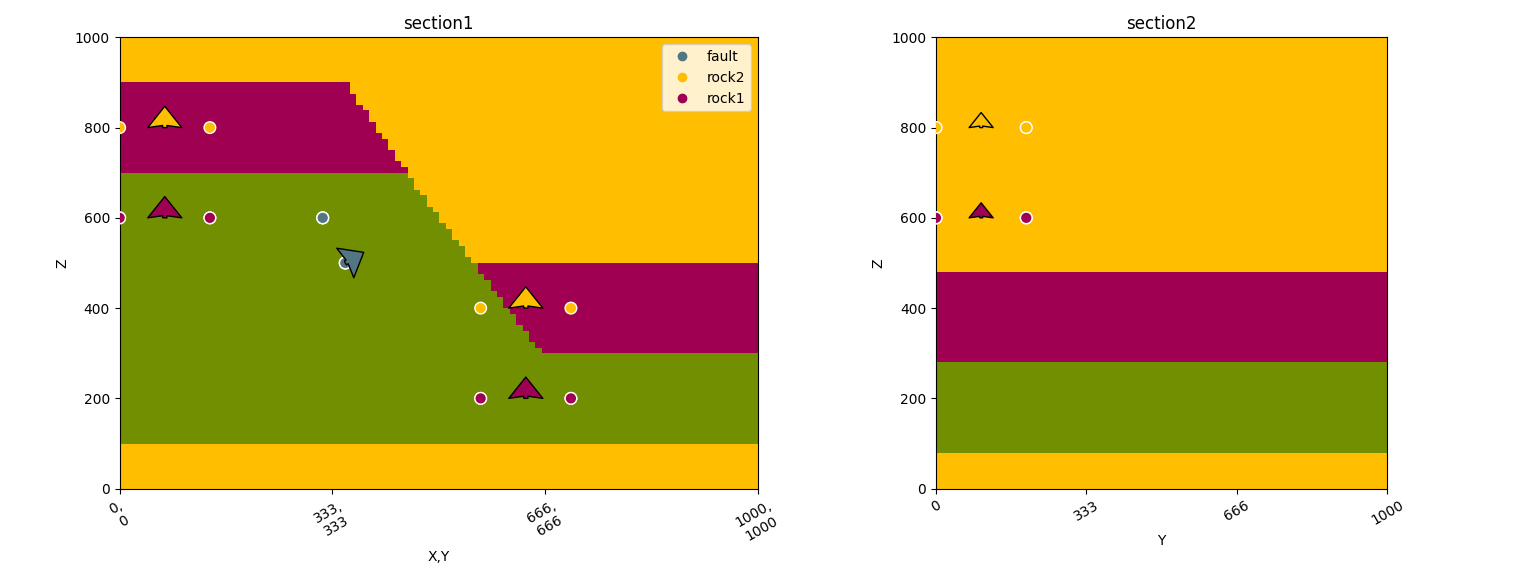
/opt/buildAgent/work/3a8738c25f60c3c9/venv/lib/python3.14/site-packages/gempy_viewer/API/_plot_2d_sections_api.py:112: UserWarning: Section contacts not implemented yet. We need to pass scalar field for the sections grid
  warnings.warn(

<gempy_viewer.modules.plot_2d.visualization_2d.Plot2D object at 0x7f580edb54d0>
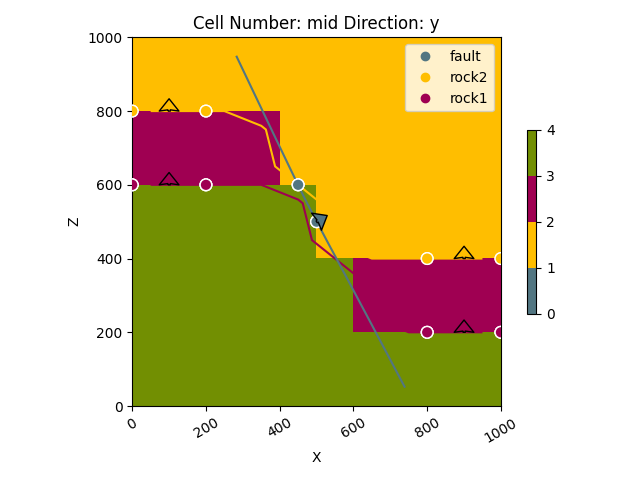
gpv.plot_2d(geo_data, figsize=(15, 15), section_names=['section1', 'section2', 'topography'], cell_number='mid')
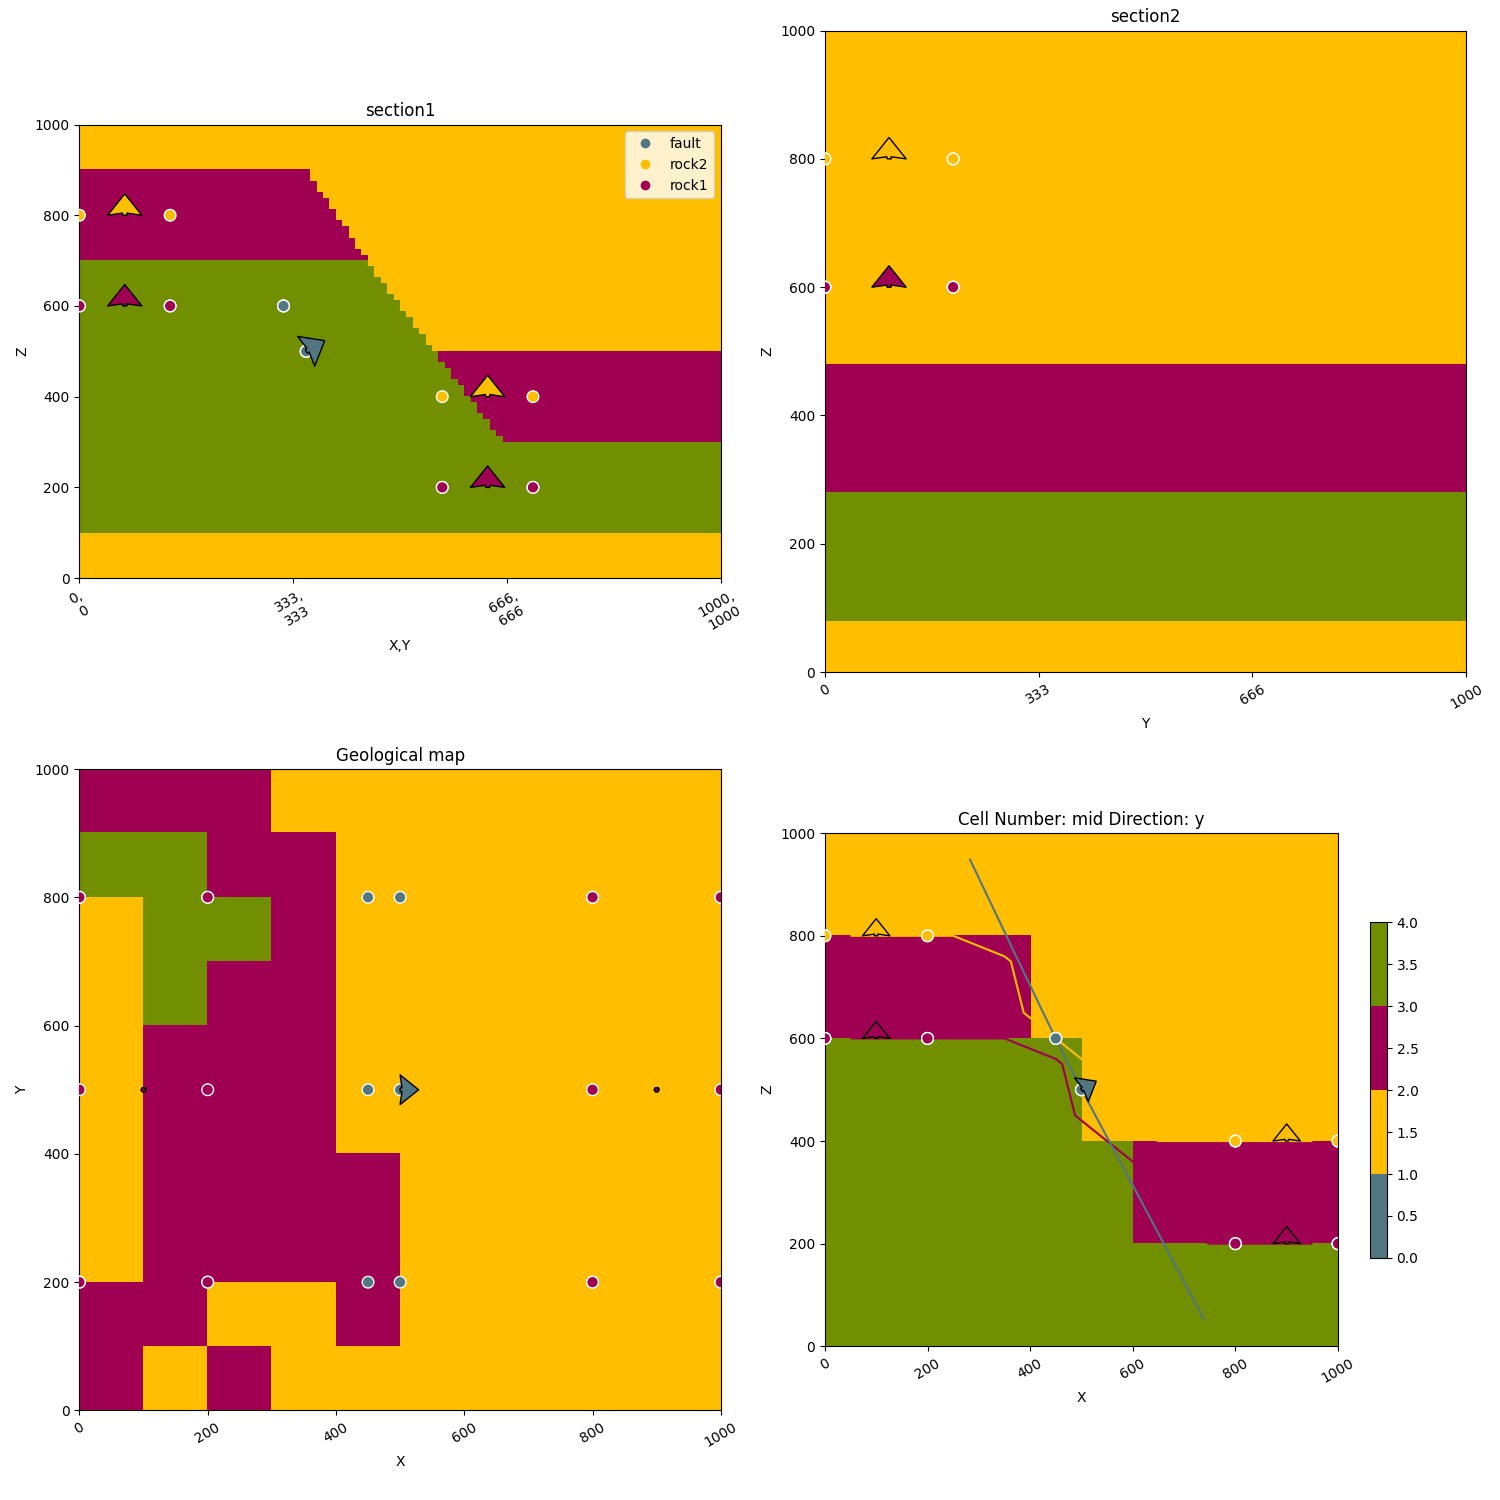
/opt/buildAgent/work/3a8738c25f60c3c9/venv/lib/python3.14/site-packages/gempy_viewer/API/_plot_2d_sections_api.py:112: UserWarning: Section contacts not implemented yet. We need to pass scalar field for the sections grid
  warnings.warn(

<gempy_viewer.modules.plot_2d.visualization_2d.Plot2D object at 0x7f57bff68f50>
Total running time of the script: (0 minutes 2.527 seconds)
