Note
Click here to download the full example code
GemPy - Subsurface Link
import pooch
import numpy as np
import pandas as pd

import subsurface as sb
from subsurface.reader import read_netcdf

data_url = "https://raw.githubusercontent.com/softwareunderground/subsurface/t21-main/examples/tutorials/wells_unstructured.nc"

data_hash = '05198041f2bffcc03d138f7f2b1802657228725c4a895d819d4f5fbc0e9978ca'
borehole_unstructured_data_file = pooch.retrieve(url=data_url,
                                                 known_hash=data_hash)

unstruct = read_netcdf.read_unstruct(borehole_unstructured_data_file)
unstruct
Out:
<xarray.Dataset>
Dimensions:       (XYZ: 3, cell: 3283, cell_attr: 1, nodes: 2, points: 3350, vertex_attr: 0)
Coordinates:
  * points        (points) int64 0 1 2 3 4 5 6 ... 3344 3345 3346 3347 3348 3349
  * XYZ           (XYZ) object 'X' 'Y' 'Z'
  * cell_attr     (cell_attr) object 'lith_log'
  * vertex_attr   (vertex_attr) int64
    UWI           (cell) object ...
    Depth         (cell) float64 ...
Dimensions without coordinates: cell, nodes
Data variables:
    vertex        (points, XYZ) float64 2.796e+05 3.943e+06 ... -3.33e+03
    cells         (cell, nodes) int64 ...
    cell_attrs    (cell, cell_attr) int64 ...
    vertex_attrs  (points, vertex_attr) float64 ...
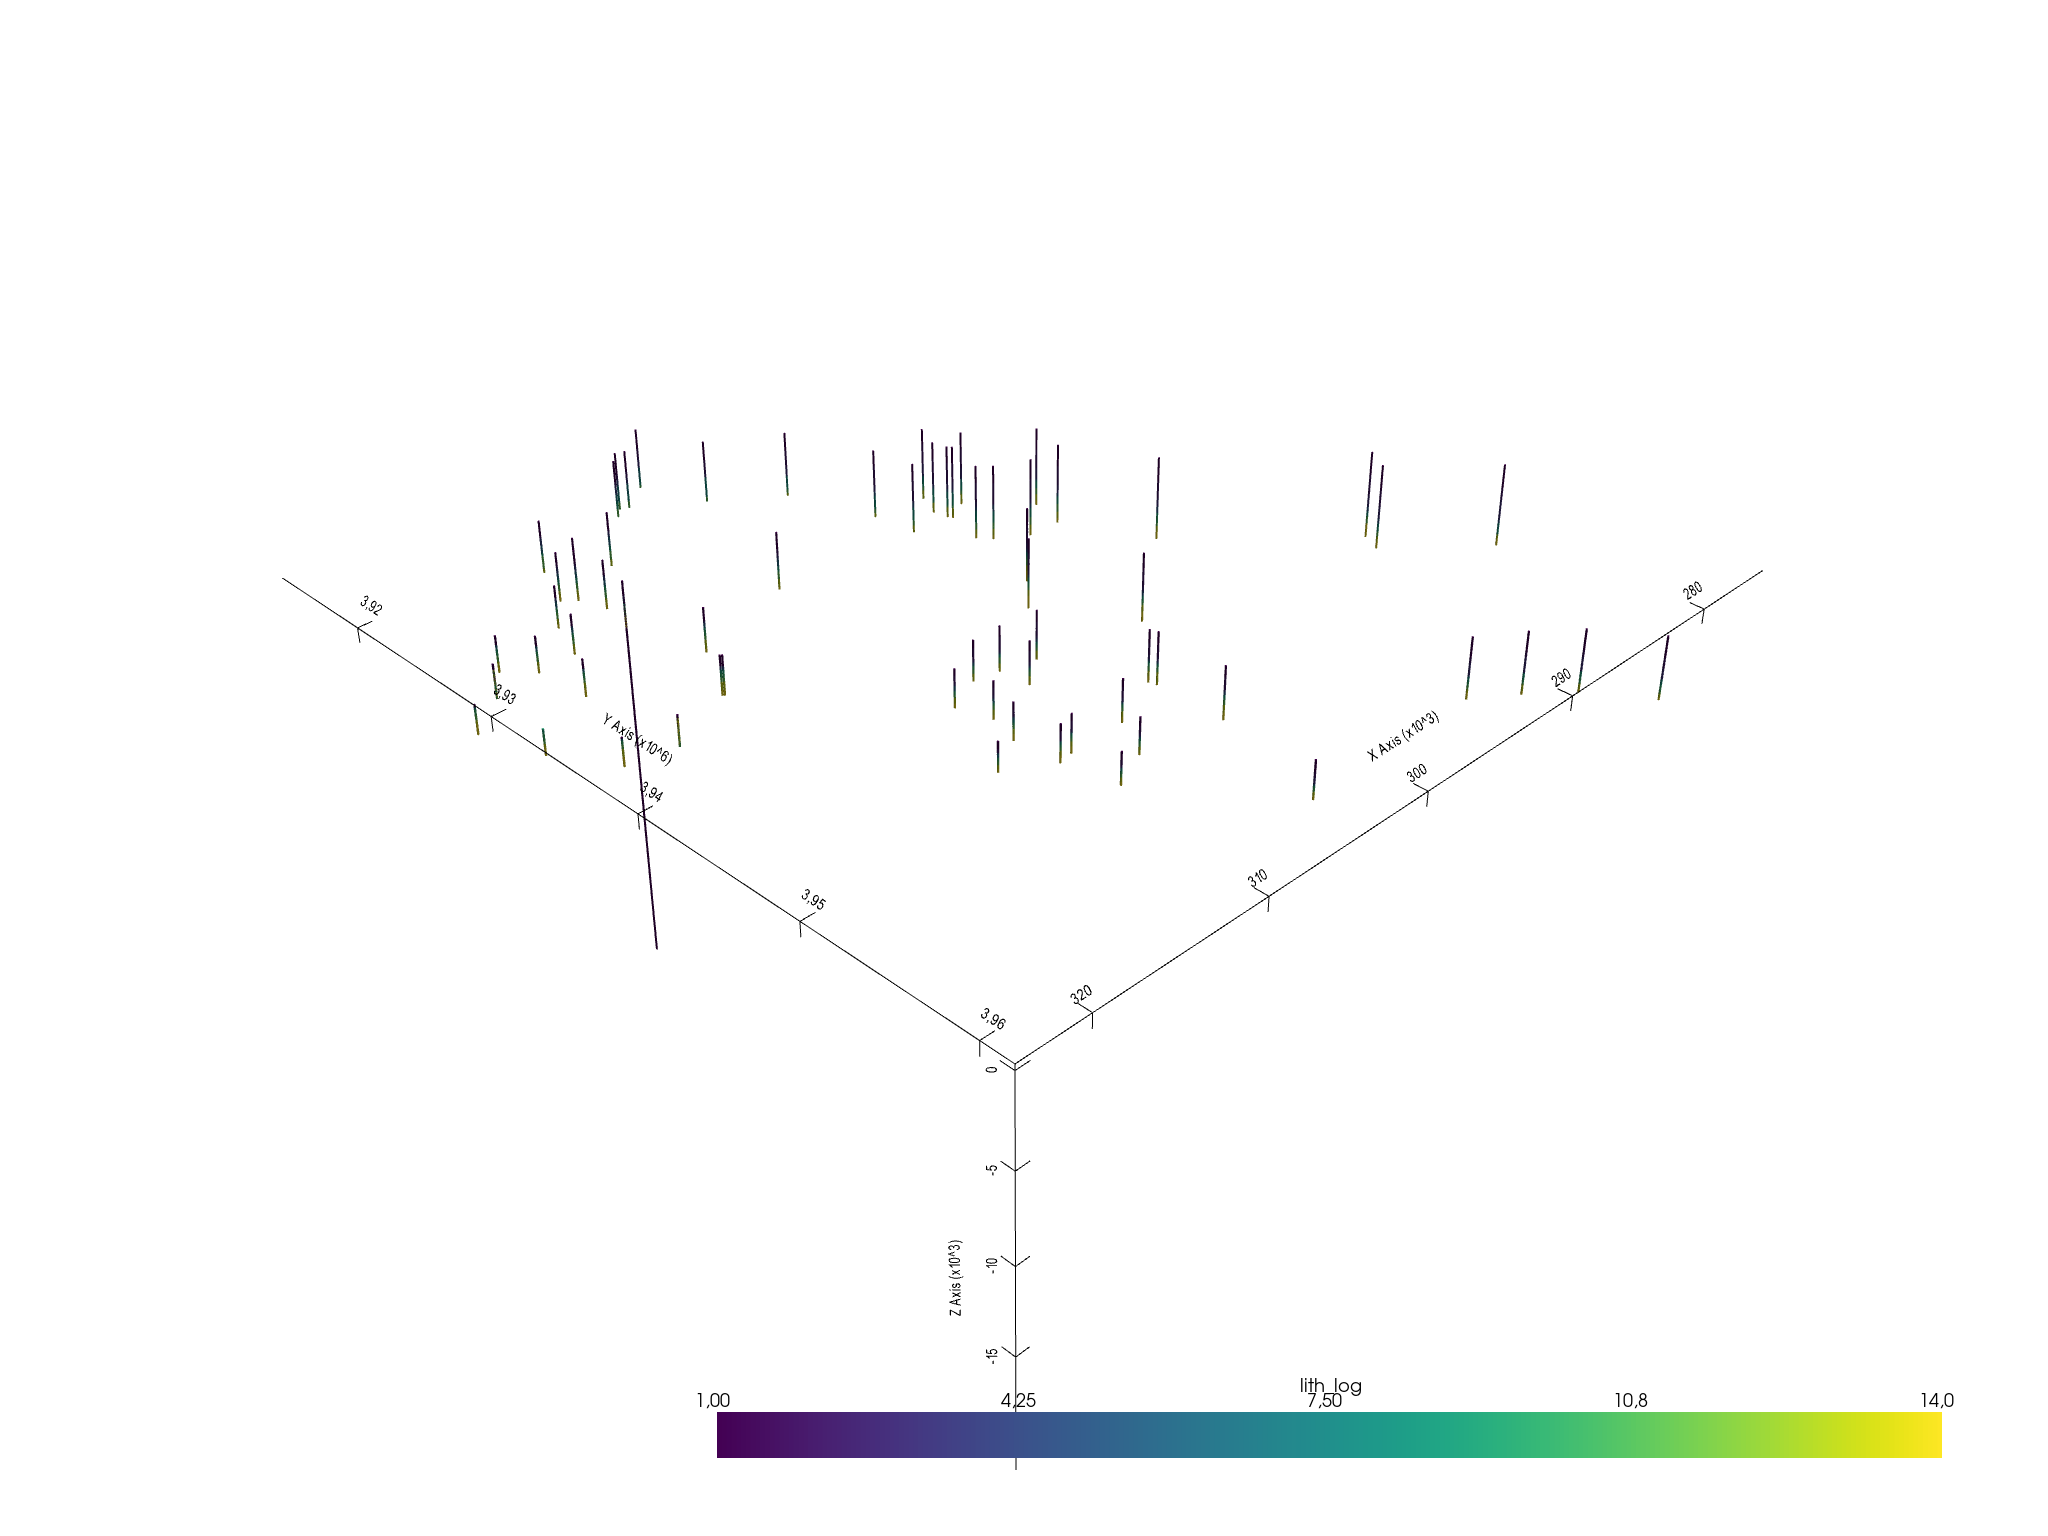
element = sb.LineSet(unstruct)
lines_mesh = sb.visualization.to_pyvista_line(element, radius=50)

# Plot default LITH
sb.visualization.pv_plot([lines_mesh])

Out:
<pyvista.plotting.plotting.Plotter object at 0x7fcb8b277250>
Findig the boreholes bases
GemPy interpolates the bottom of a unit, therefore we need to be able to extract those points to be able tointerpolate them. xarray, pandas and numpy are using the same type of memory representation what makes possible to use the same or at least similar methods to manipulate the data to our will. Lets find the base points of each well:
# Creating references to the xarray.DataArray
cells_attr = unstruct.data.cell_attrs
cells = unstruct.data.cells
vertex = unstruct.data.vertex
# Find vertex points at the boundary of two units
# Marking each vertex
bool_prop_change = cells_attr.values[1:] != cells_attr.values[:-1]
# Getting the index of the vertex
args_prop_change = np.where(bool_prop_change)[0]
# Getting the attr values at those points
vals_prop_change = cells_attr[args_prop_change]
vals_prop_change.to_pandas()
Getting the vertex values at those points
vertex_args_prop_change = cells[args_prop_change, 1]
interface_points = vertex[vertex_args_prop_change]
interface_points
Creating a new UnstructuredData
interf_us= sb.UnstructuredData.from_array(vertex=interface_points.values, cells="points",
                                          cells_attr=vals_prop_change.to_pandas())
interf_us
Out:
<xarray.Dataset>
Dimensions:       (XYZ: 3, cell: 595, cell_attr: 1, nodes: 1, points: 595, vertex_attr: 0)
Coordinates:
  * points        (points) int64 0 1 2 3 4 5 6 7 ... 588 589 590 591 592 593 594
  * XYZ           (XYZ) <U1 'X' 'Y' 'Z'
  * cell_attr     (cell_attr) object 'lith_log'
  * vertex_attr   (vertex_attr) int64
    cell_         (cell) int64 0 1 2 3 4 5 6 7 ... 588 589 590 591 592 593 594
Dimensions without coordinates: cell, nodes
Data variables:
    vertex        (points, XYZ) float64 2.796e+05 3.943e+06 ... -3.121e+03
    cells         (cell, nodes) int64 0 1 2 3 4 5 6 ... 589 590 591 592 593 594
    cell_attrs    (cell, cell_attr) int64 1 2 3 5 8 9 11 13 ... 2 3 8 9 10 11 13
    vertex_attrs  (points, vertex_attr) float64
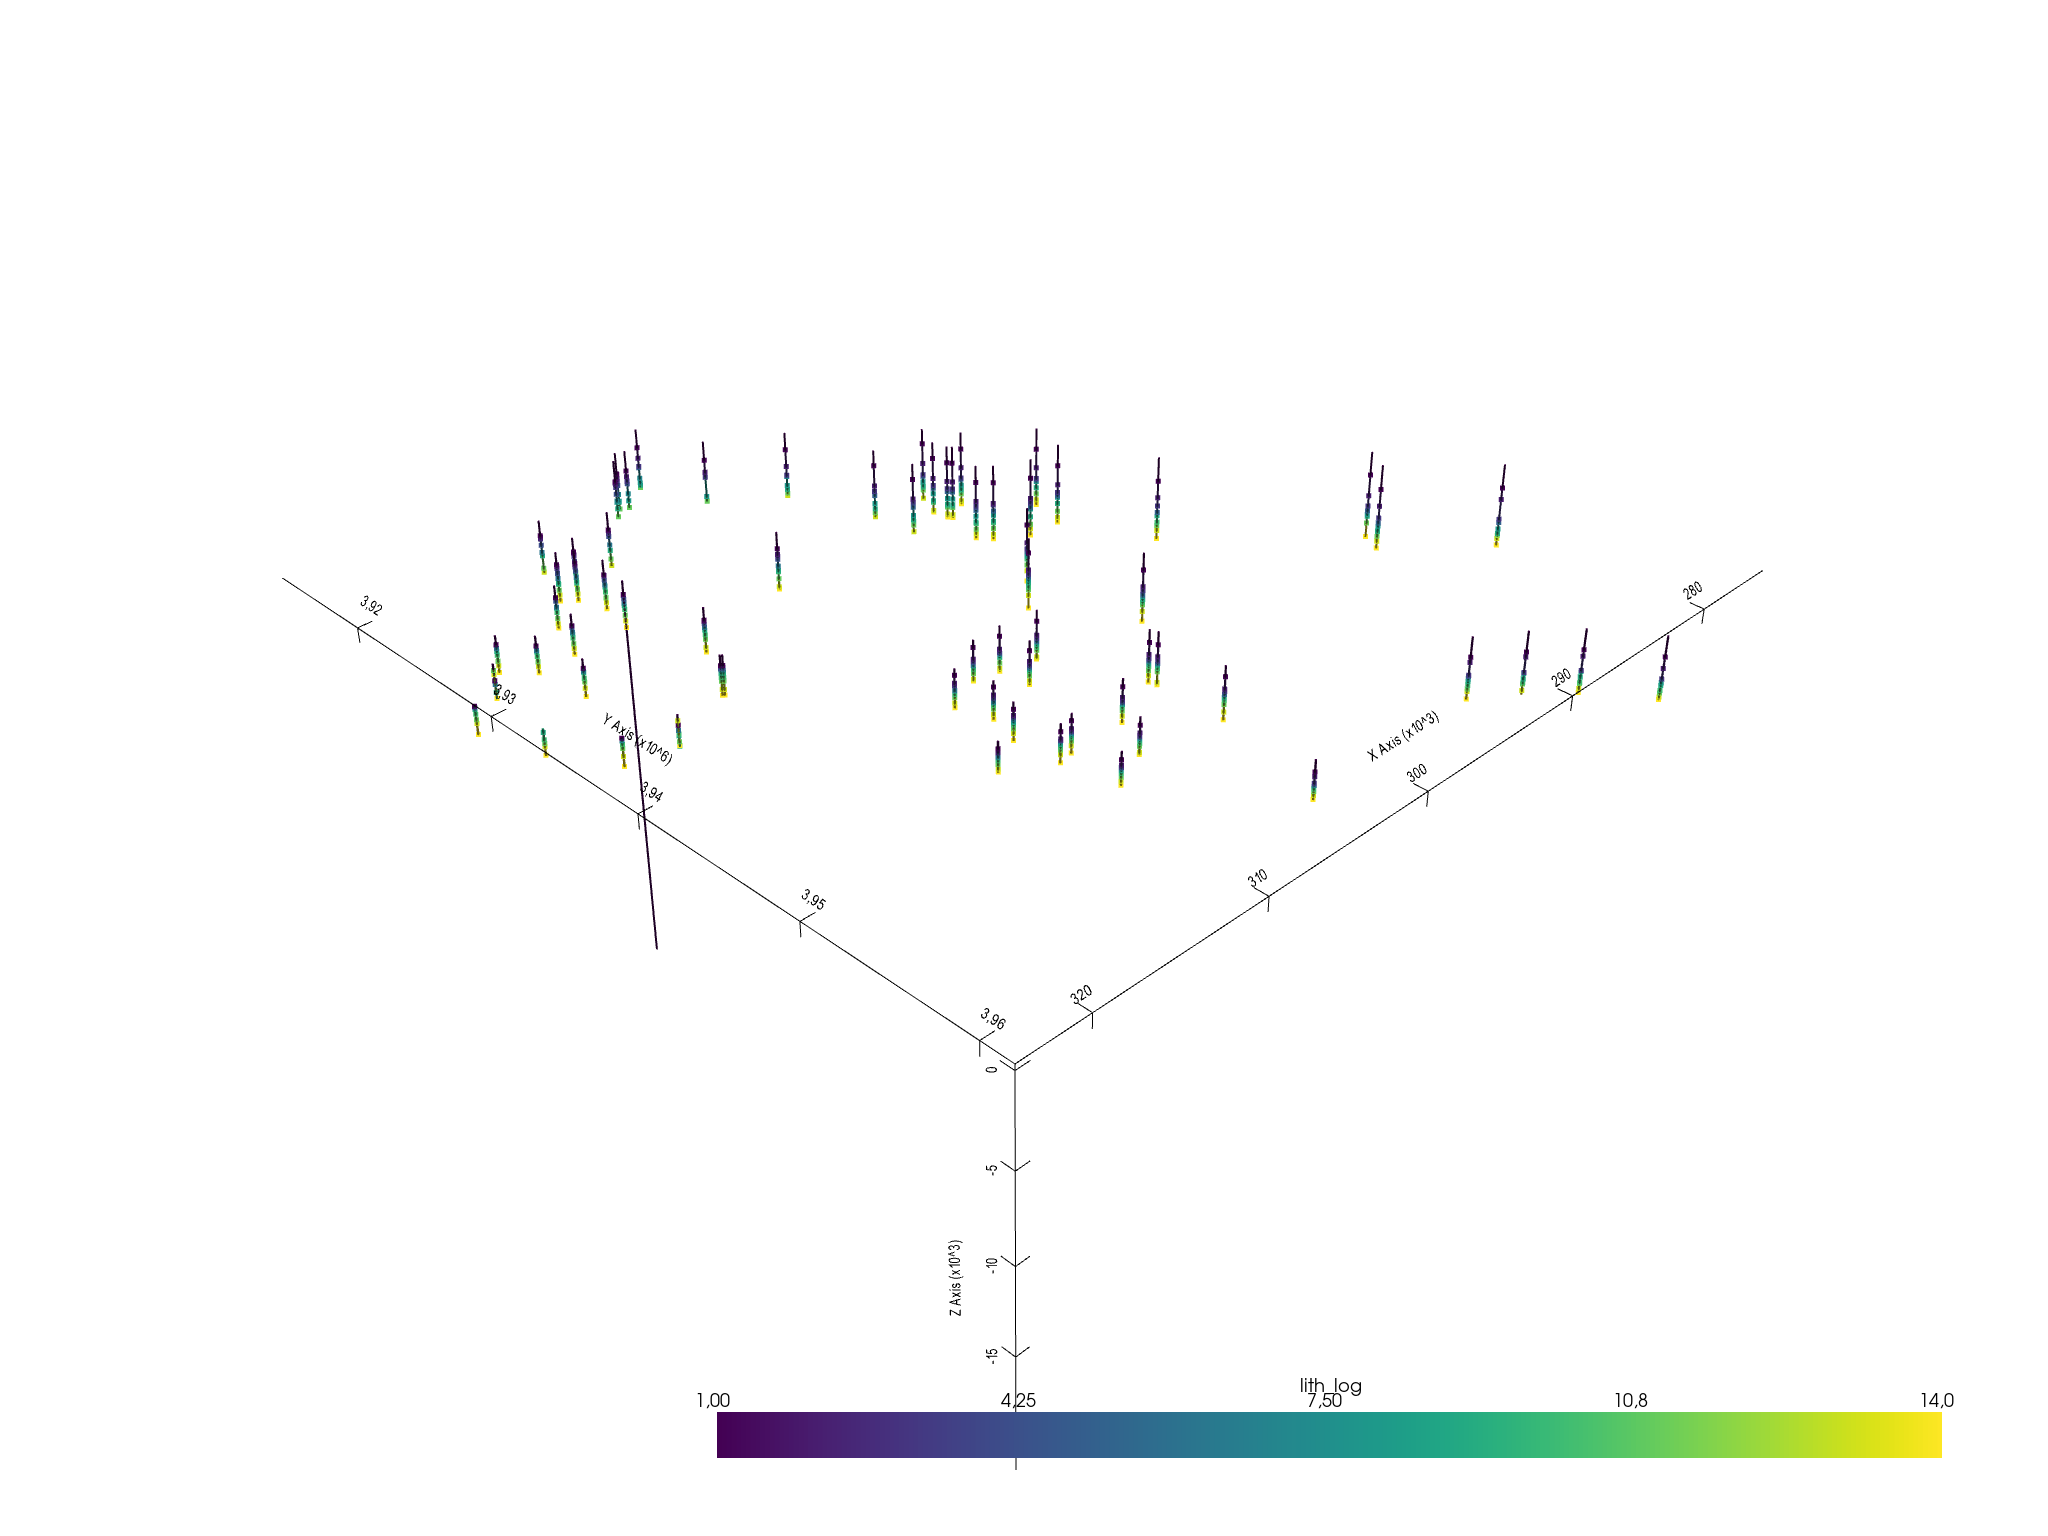
This new UnstructuredData object instead containing data that represent lines, contain point data at the bottom of each unit. We can plot it very similar as before:
element = sb.PointSet(interf_us)
point_mesh = sb.visualization.to_pyvista_points(element)
sb.visualization.pv_plot([lines_mesh, point_mesh])

Out:
<pyvista.plotting.plotting.Plotter object at 0x7fcc6b77a3a0>
GemPy: Initialize model
The first step to create a GemPy model is create a gempy.
import gempy as gp
geo_model = gp.create_model("getting started")
geo_model.set_regular_grid(extent=[275619, 323824, 3914125, 3961793, -3972.6, 313.922], resolution=[50,50,50])
gp.set_interpolator(geo_model, theano_optimizer='fast_compile', verbose=[])
Out:
Active grids: ['regular']
Setting kriging parameters to their default values.
Compiling theano function...
Level of Optimization:  fast_compile
Device:  cpu
Precision:  float64
Number of faults:  0
Compilation Done!
Kriging values:
                        values
range                67928.89
$C_o$            109865107.62
drift equations           [3]

<gempy.core.interpolator.InterpolatorModel object at 0x7fcb84ea4f70>
Making a model step by step.
# The temptation at this point is to bring all the points into gempy and just interpolate. However, often that strategy
# results in ill posed problems due to noise or irregularities in the data. gempy has been design to being able to
# iterate rapidly and therefore a much better workflow use to be creating the model step by step.
#
# To do that, lets define a function that we can pass the name of the formation and get the assotiated vertex. Grab from
# the interf_us the XYZ coordinates of the first layer:
def get_interface_coord_from_surfaces(surface_names: list, verbose=False):
    df = pd.DataFrame(columns=["X", "Y", "Z", "surface"])

    for e, surface_name in enumerate(surface_names):
        # The properties in subsurface start at 1
        val_property = formations.index(surface_name) + 1
        # Find the cells with the surface id
        args_from_first_surface = np.where(vals_prop_change == val_property)[0]
        if verbose: print(args_from_first_surface)
        # Find the vertex
        points_from_first_surface = interface_points[args_from_first_surface]
        if verbose: print(points_from_first_surface)

        # xarray.DataArray to pandas.DataFrame
        surface_pandas = points_from_first_surface.to_pandas()

        # Add formation column
        surface_pandas["surface"] = surface_name
        df = df.append(surface_pandas)

    return df.reset_index()
Surfaces
formations = ["topo", "etchegoin", "macoma", "chanac", "mclure",
              "santa_margarita", "fruitvale",
              "round_mountain", "olcese", "freeman_jewett", "vedder", "eocene",
              "cretaceous",
              "basement", "null"]
geo_model.add_features("Formations")
one_formation_every = 3
geo_model.add_surfaces(formations[0:4*one_formation_every:one_formation_every])

geo_model.map_stack_to_surfaces({"Formations": ["etchegoin", "macoma", "chanac", "mclure"],
                                 "Default series": ["topo"]},
                                set_series=False)
gempy_surface_points = get_interface_coord_from_surfaces(formations[0:3*one_formation_every:one_formation_every])
geo_model.set_surface_points(gempy_surface_points, update_surfaces=False)
geo_model.update_to_interpolator()
Out:
True
Adding orientations
find neighbours
neighbours = gp.select_nearest_surfaces_points(geo_model, geo_model._surface_points.df, 2)

# calculate all fault orientations
gp.set_orientation_from_neighbours_all(geo_model, neighbours)
Using the flag to subsurface, the result of the interpolation will get stored in subsurface data objects. In the future exporting to subsurface will be the default behaviour.
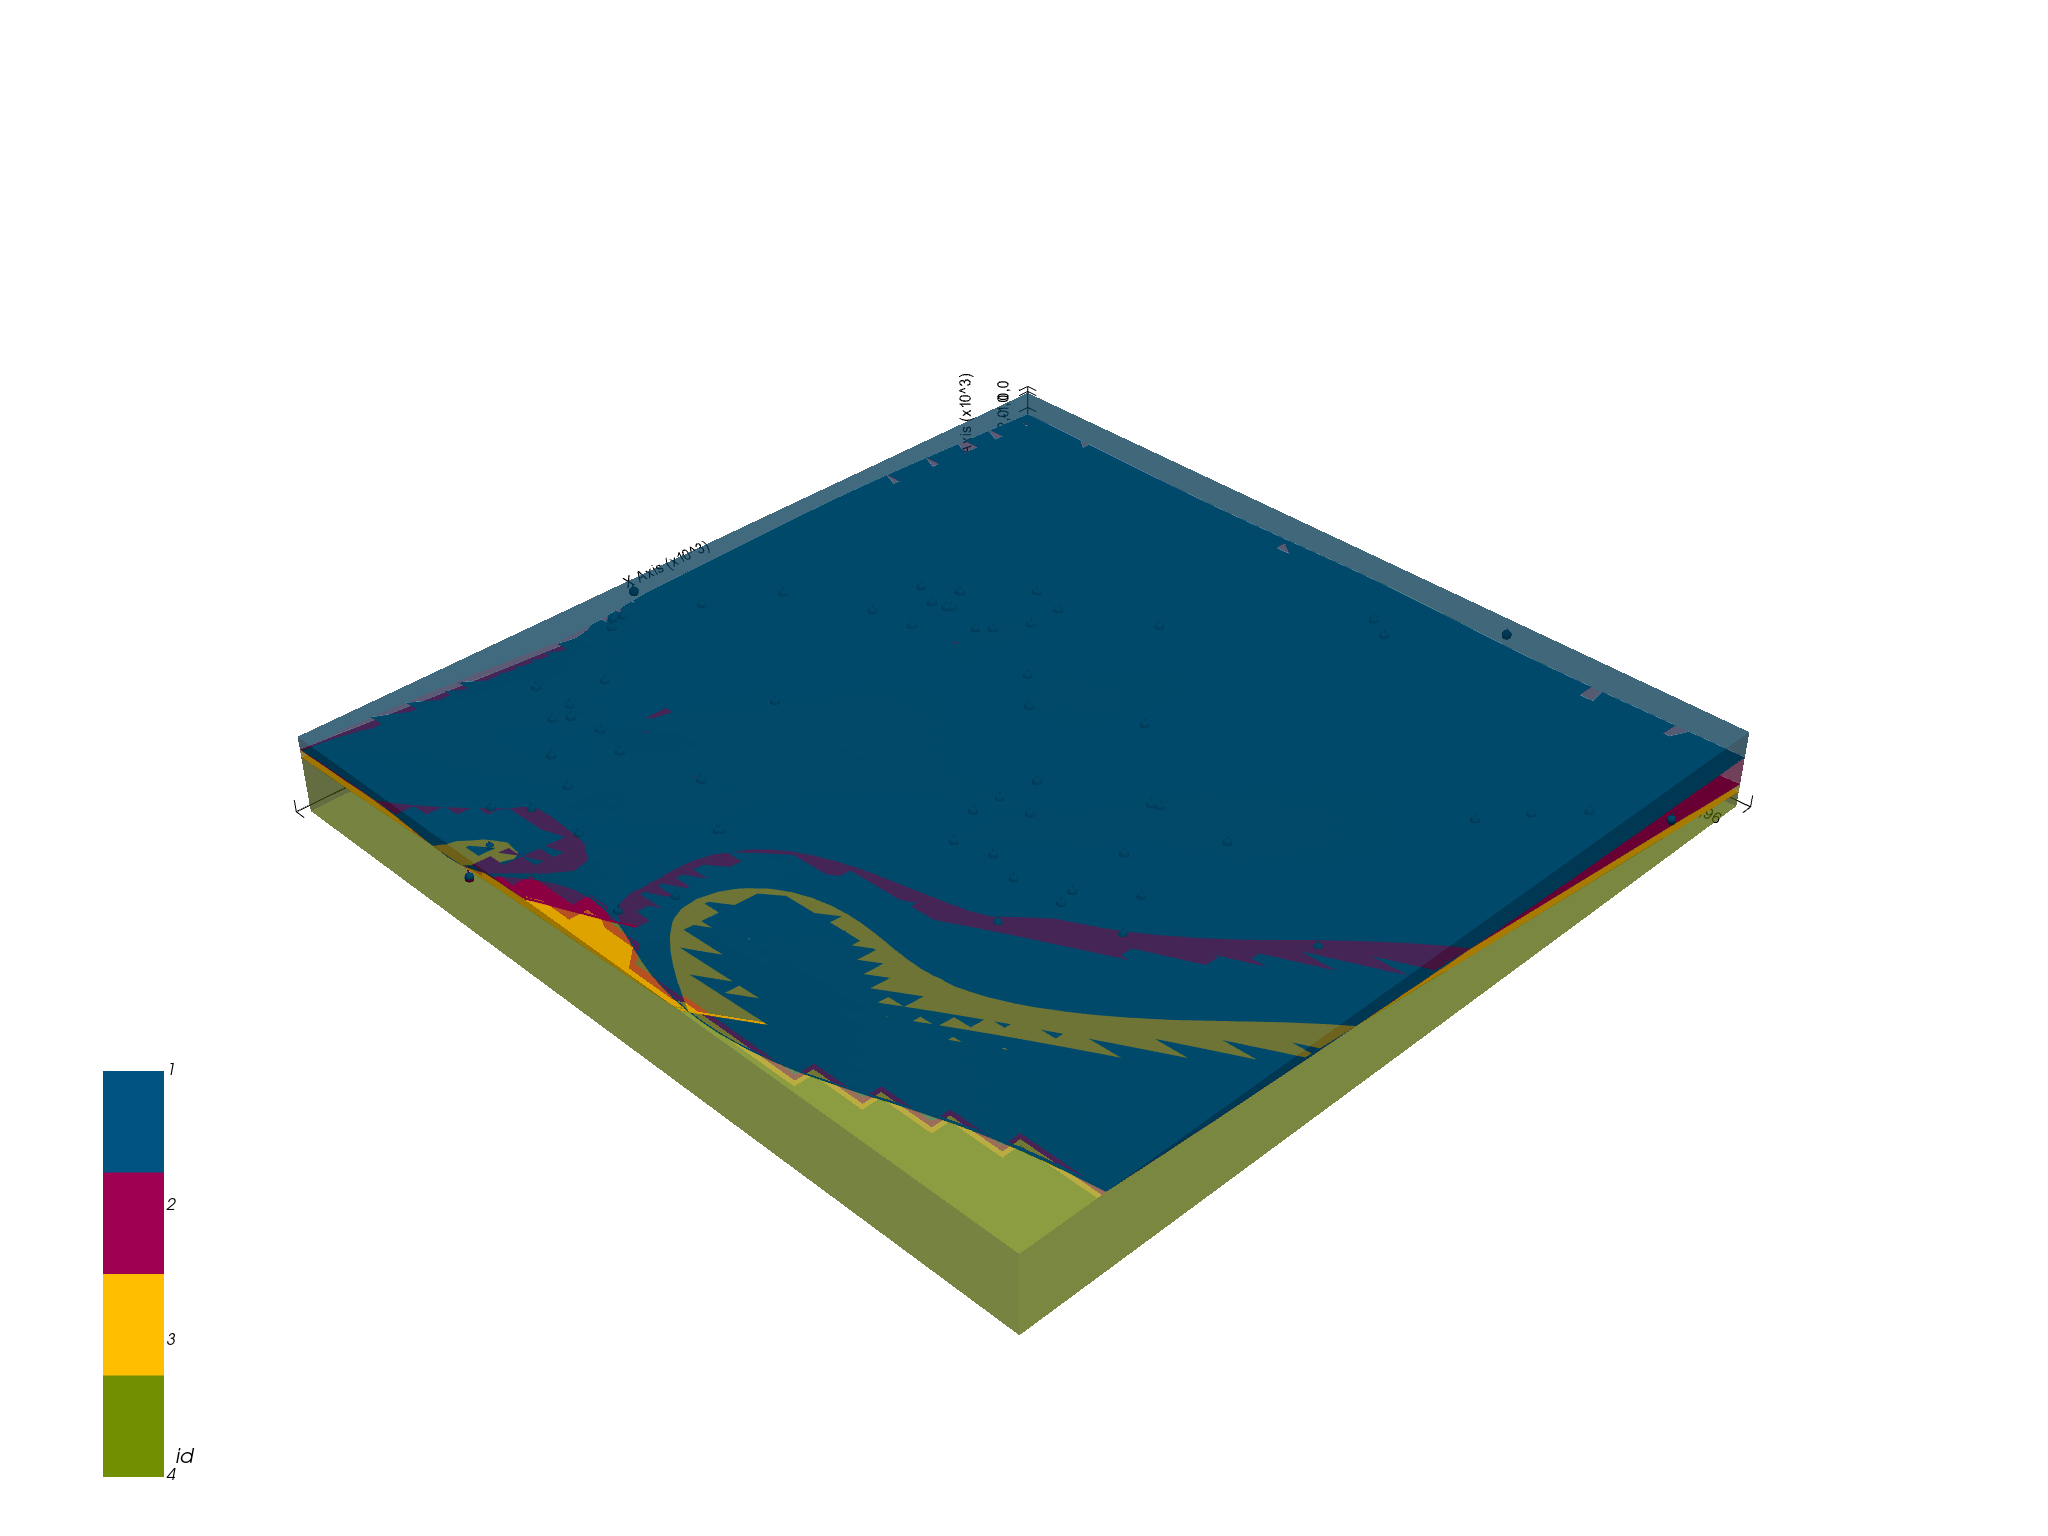
gp.compute_model(geo_model, to_subsurface=True)
Out:
Lithology ids
  [2. 2. 2. ... 4. 4. 4.]
p3d = gp.plot_3d(geo_model)

geo_model.solutions.s_regular_grid
Out:
StructuredData(data=<xarray.Dataset>
Dimensions:              (Features: 2, Properties: 1, X: 50, Y: 50, Z: 50)
Coordinates:
  * Features             (Features) <U14 'Default series' 'Formations'
  * Properties           (Properties) <U2 'id'
  * X                    (X) float64 2.761e+05 2.771e+05 ... 3.224e+05 3.233e+05
  * Y                    (Y) float64 3.915e+06 3.916e+06 ... 3.96e+06 3.961e+06
  * Z                    (Z) float64 -3.93e+03 -3.844e+03 ... 185.3 271.1
Data variables:
    property_matrix      (Properties, X, Y, Z) float64 2.0 2.0 2.0 ... 4.0 4.0
    block_matrix         (Features, Properties, X, Y, Z) float64 2.0 2.0 ... 4.0
    scalar_field_matrix  (Features, X, Y, Z) float64 0.8969 0.8986 ... 0.8362
    mask_matrix          (Features, X, Y, Z) bool False False ... True True
    fault_mask           (Features, X, Y, Z) bool False False ... False False, data_array_name='data_array')
geo_model.solutions.meshes
Out:
<xarray.Dataset>
Dimensions:       (XYZ: 3, cell: 27514, cell_attr: 1, nodes: 3, points: 14290, vertex_attr: 0)
Coordinates:
  * points        (points) int64 0 1 2 3 4 5 ... 14285 14286 14287 14288 14289
  * XYZ           (XYZ) <U1 'X' 'Y' 'Z'
  * cell_attr     (cell_attr) object 'id'
  * vertex_attr   (vertex_attr) int64
    cell_         (cell) int64 0 1 2 3 4 5 ... 27509 27510 27511 27512 27513
Dimensions without coordinates: cell, nodes
Data variables:
    vertex        (points, XYZ) float64 2.769e+05 3.915e+06 ... 3.943e+06 271.1
    cells         (cell, nodes) int32 2 1 0 1 3 ... 14212 14289 14219 14215
    cell_attrs    (cell, cell_attr) float64 1.0 1.0 1.0 1.0 ... 3.0 3.0 3.0 3.0
    vertex_attrs  (points, vertex_attr) float64
Total running time of the script: ( 0 minutes 15.762 seconds)
