Note
Go to the end to download the full example code.
Geomodeling benchmark: the “Claudius”-Model
This model is part of a geomodeling benchmaring effort. More information (and, hopefully, publication) coming.
import sys, os

# Importing gempy
import gempy as gp
import gempy_viewer as gpv

# Aux imports
import numpy as np
import pandas as pn
Loading data from repository:
With pandas we can do it directly from the web and with the right args we can directly tidy the data in gempy style:
data_path = os.path.abspath('../../data/input_data/Claudius')

reduce_data_by = 30

dfs = []
for letter in 'ABCD':
    dfs.append(
        pn.read_csv(
            filepath_or_buffer=f"{data_path}/{letter}Points.csv",
            sep=';',
            names=['X', 'Y', 'Z', 'surface', 'cutoff'],
            header=0
        )[::reduce_data_by]
    )

# Add fault:
dfs.append(
    pn.read_csv(
        filepath_or_buffer=f"{data_path}/Fault.csv",
        names=['X', 'Y', 'Z', 'surface'],
        header=0,
        sep=','
    )
)

surface_points = pn.concat(dfs, sort=True)
surface_points['surface'] = surface_points['surface'].astype('str')
surface_points.reset_index(inplace=True, drop=False)
surface_points.tail()
surface_points.dtypes
index        int64
X          float64
Y          float64
Z          float64
cutoff     float64
surface     object
dtype: object
How many points are per surface
surface_points.groupby('surface').count()
Now we do the same with the orientations:
dfs = []

for surf in ['0', '330']:
    o = pn.read_csv(
        filepath_or_buffer=f"{data_path}/Dips.csv",
        sep=';',
        names=['X', 'Y', 'Z', 'G_x', 'G_y', 'G_z', '-'],
        header=1
    )

    # Orientation needs to belong to a surface. This is mainly to categorize to which series belong and to
    # use the same color
    o['surface'] = surf
    dfs.append(o)
orientations = pn.concat(dfs, sort=True)
orientations.reset_index(inplace=True, drop=False)

orientations.tail()
orientations.dtypes
index        int64
-          float64
G_x        float64
G_y        float64
G_z        float64
X          float64
Y          float64
Z          float64
surface     object
dtype: object
Data initialization:
Suggested size of the axis-aligned modeling box: Origin: 548800 7816600 -8400 Maximum: 552500 7822000 -11010
Suggested resolution: 100m x 100m x -90m (grid size 38 x 55 x 30)
Number of voxels:
np.array([38, 55, 30]).prod()

surface_points_table: gp.data.SurfacePointsTable = gp.data.SurfacePointsTable.from_arrays(
    x=surface_points['X'].values,
    y=surface_points['Y'].values,
    z=surface_points['Z'].values,
    names=surface_points['surface'].values
)

orientations_table: gp.data.OrientationsTable = gp.data.OrientationsTable.from_arrays(
    x=orientations['X'].values,
    y=orientations['Y'].values,
    z=orientations['Z'].values,
    G_x=orientations['G_x'].values,
    G_y=orientations['G_y'].values,
    G_z=orientations['G_z'].values,
    names=orientations['surface'].values,
    name_id_map=surface_points_table.name_id_map  # ! Make sure that ids and names are shared
)

structural_frame: gp.data.StructuralFrame = gp.data.StructuralFrame.from_data_tables(
    surface_points=surface_points_table,
    orientations=orientations_table
)

geo_model: gp.data.GeoModel = gp.create_geomodel(
    project_name='Claudius',
    extent=[548800, 552500, 7816600, 7822000, -11010, -8400],
    resolution=[38, 55, 30],
    refinement=5,
    structural_frame=structural_frame
)

group_fault = gp.data.StructuralGroup(
    name='Fault1',
    elements=[geo_model.structural_frame.structural_elements.pop(-2)],
    structural_relation=gp.data.StackRelationType.FAULT,
    fault_relations=gp.data.FaultsRelationSpecialCase.OFFSET_ALL
)

geo_model.structural_frame.get_group_by_name("default_formation").elements.pop(-1)

# Insert the fault group into the structural frame:
geo_model.structural_frame.insert_group(0, group_fault)

gp.set_is_fault(
    frame=geo_model.structural_frame,
    fault_groups=[geo_model.structural_frame.get_group_by_name('Fault1')]
)

print(geo_model)
meta=GeoModelMeta(name='Claudius', creation_date='2026-06-18T08:40:32.287726', last_modification_date=None, owner=None) structural_frame=StructuralFrame(
        structural_groups=[
StructuralGroup(
        name=Fault1,
        structural_relation=StackRelationType.FAULT,
        elements=[
Element(
        name=Claudius_fault,
        color=#527682,
        is_active=True
)
]
),
StructuralGroup(
        name=default_formation,
        structural_relation=StackRelationType.ERODE,
        elements=[
Element(
        name=0,
        color=#015482,
        is_active=True
),
Element(
        name=250,
        color=#9f0052,
        is_active=True
),
Element(
        name=330,
        color=#ffbe00,
        is_active=True
),
Element(
        name=60,
        color=#728f02,
        is_active=True
)
]
)
],
        fault_relations=
[[False,  True],
 [False, False]],
 grid=Grid(values=array([[ 548848.68421053, 7816649.09090909,  -10966.5       ],
       [ 548848.68421053, 7816649.09090909,  -10879.5       ],
       [ 548848.68421053, 7816649.09090909,  -10792.5       ],
       ...,
       [ 552451.31578947, 7821950.90909091,   -8617.5       ],
       [ 552451.31578947, 7821950.90909091,   -8530.5       ],
       [ 552451.31578947, 7821950.90909091,   -8443.5       ]],
      shape=(62700, 3)), length=array([], dtype=float64), _octree_grid=None, _dense_grid=RegularGrid(resolution=array([38, 55, 30]), extent=array([ 548800.,  552500., 7816600., 7822000.,  -11010.,   -8400.]), values=array([[ 548848.68421053, 7816649.09090909,  -10966.5       ],
       [ 548848.68421053, 7816649.09090909,  -10879.5       ],
       [ 548848.68421053, 7816649.09090909,  -10792.5       ],
       ...,
       [ 552451.31578947, 7821950.90909091,   -8617.5       ],
       [ 552451.31578947, 7821950.90909091,   -8530.5       ],
       [ 552451.31578947, 7821950.90909091,   -8443.5       ]],
      shape=(62700, 3)), mask_topo=array([], shape=(0, 3), dtype=bool), _transform=None, _base_resolution=array([2, 2, 2])), _custom_grid=None, _topography=None, _sections=None, _centered_grid=None, _transform=None, _octree_levels=-1) geophysics_input=None input_transform={'_cached_pivot': None,
 '_is_default_transform': False,
 'position': array([ -550658.0605    , -7819213.97425586,     9824.6748045 ]),
 'rotation': array([0., 0., 0.]),
 'scale': array([9.56397917e-05, 9.56397917e-05, 9.56397917e-05])} interpolation_grid=None interpolation_options=InterpolationOptions(kernel_options=KernelOptions(range=1.7, c_o=10.0, uni_degree=1, i_res=4.0, gi_res=2.0, number_dimensions=3, kernel_function=AvailableKernelFunctions.cubic, kernel_solver=Solvers.DEFAULT, compute_condition_number=False, optimizing_condition_number=False, condition_number=None), evaluation_options=EvaluationOptions(_number_octree_levels=5, _number_octree_levels_surface=4, octree_curvature_threshold=-1.0, octree_error_threshold=1.0, octree_min_level=2, mesh_extraction=True, mesh_extraction_masking_options=<MeshExtractionMaskingOptions.INTERSECT: 3>, mesh_extraction_fancy=True, evaluation_chunk_size=500000, compute_scalar=True, compute_scalar_gradient=False, verbose=False), debug=False, cache_mode=<CacheMode.IN_MEMORY_CACHE: 3>, cache_model_name='Claudius', block_solutions_type=<BlockSolutionType.DENSE_GRID: 2>, sigmoid_slope=5000000)
We are going to increase the smoothness (nugget) of the data to increase the conditional number of the matrix:
gp.modify_surface_points(geo_model, nugget=0.01)
Also the original poles are pointing downwards. We can change the direction by calling the following:
gp.modify_orientations(geo_model, polarity=-1)
We need an orientation per series/fault. The faults does not have orientation so the easiest is to create an orientation from the surface points availablle:
element = geo_model.structural_frame.get_element_by_name("Claudius_fault")
new_orientations: gp.data.OrientationsTable = gp.create_orientations_from_surface_points_coords(
    xyz_coords=element.surface_points.xyz
)
gp.add_orientations(
    geo_model=geo_model,
    x=new_orientations.data['X'],
    y=new_orientations.data['Y'],
    z=new_orientations.data['Z'],
    pole_vector=new_orientations.grads,
    elements_names="Claudius_fault"
)
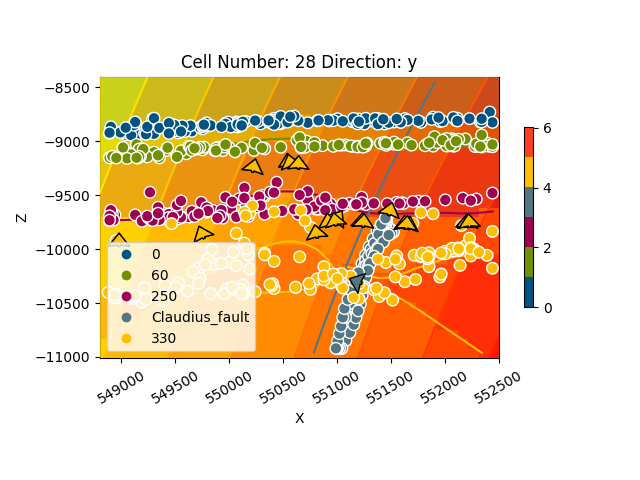
gpv.plot_2d(geo_model, direction='y')
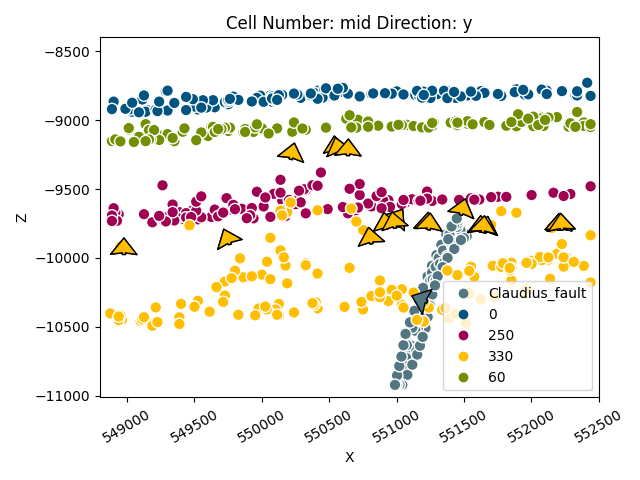
<gempy_viewer.modules.plot_2d.visualization_2d.Plot2D object at 0x7f57780ec150>
We will need to separate with surface belong to each series:
gp.map_stack_to_surfaces(
    gempy_model=geo_model,
    mapping_object={
        'Default series': ('0', '60', '250'),
        'Fault': 'Claudius_fault',
        'Uncomformity': '330',
    }
)
So far we did not specify which series/faults are actula faults:
gp.set_is_fault(
    frame=geo_model.structural_frame,
    fault_groups=[geo_model.structural_frame.get_group_by_name('Fault')]
)

geo_model.structural_frame
geo_model.interpolation_options.kernel_options.range = 1
gp.compute_model(
    geo_model,
    gp.data.GemPyEngineConfig(
        backend=gp.data.AvailableBackends.numpy,
        use_gpu=False,
        dtype='float64'
    )
)
Setting Backend To: AvailableBackends.numpy
Chunking done: 73 chunks
Chunking done: 13 chunks
Chunking done: 31 chunks
Chunking done: 7 chunks
Chunking done: 34 chunks
Chunking done: 6 chunks
Chunking done: 14 chunks
Chunking done: 19 chunks
Chunking done: 8 chunks
Chunking done: 11 chunks
sect = ['mid']

gpv.plot_2d(geo_model, cell_number=sect, series_n=1, show_scalar=True, direction='x')
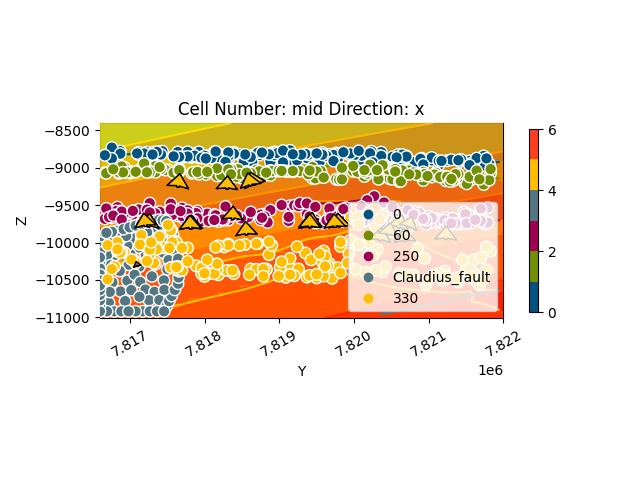
<gempy_viewer.modules.plot_2d.visualization_2d.Plot2D object at 0x7f57780ef650>
gpv.plot_2d(geo_model, cell_number=sect, show_data=True, direction='x')
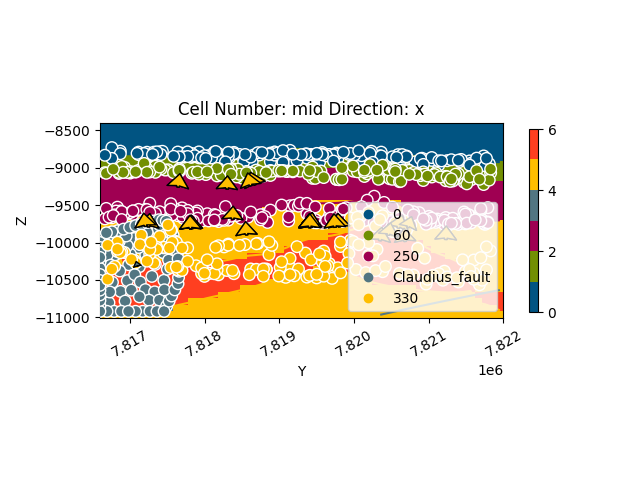
<gempy_viewer.modules.plot_2d.visualization_2d.Plot2D object at 0x7f57780ec050>
<gempy_viewer.modules.plot_2d.visualization_2d.Plot2D object at 0x7f57783b73d0>
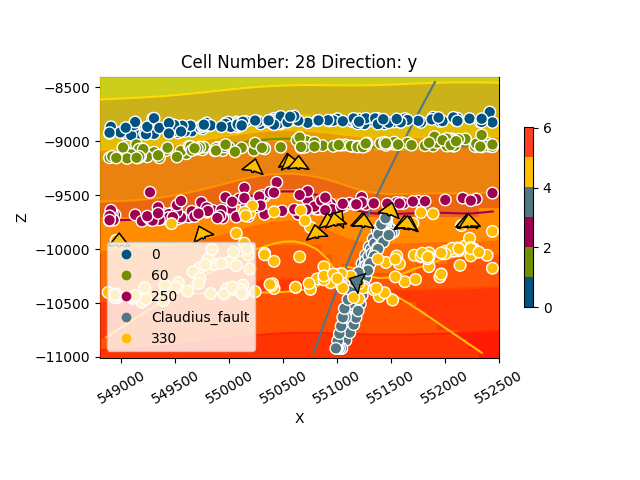
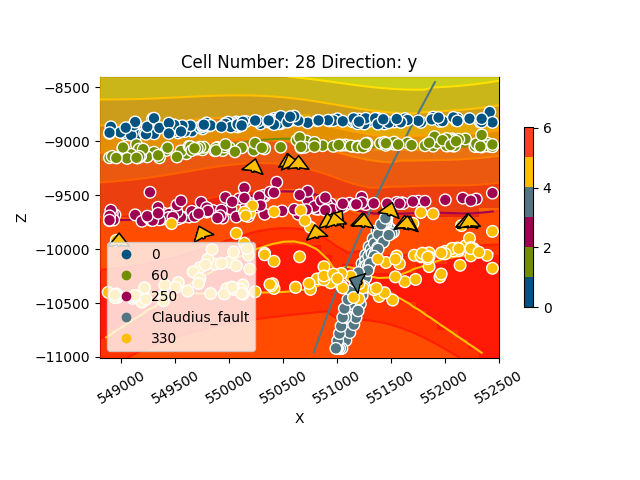
gpv.plot_2d(geo_model, cell_number=[28], show_data=True, direction='y')
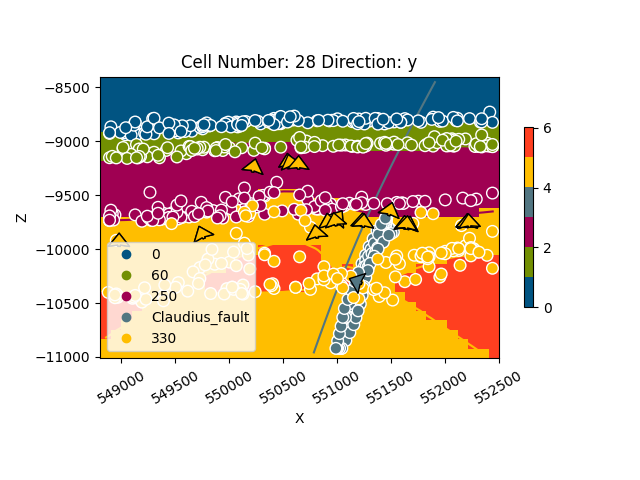
<gempy_viewer.modules.plot_2d.visualization_2d.Plot2D object at 0x7f57801313d0>
# sphinx_gallery_thumbnail_number = 8
gpv.plot_3d(geo_model, show_lith=True, show_data=True, show_boundaries=True)
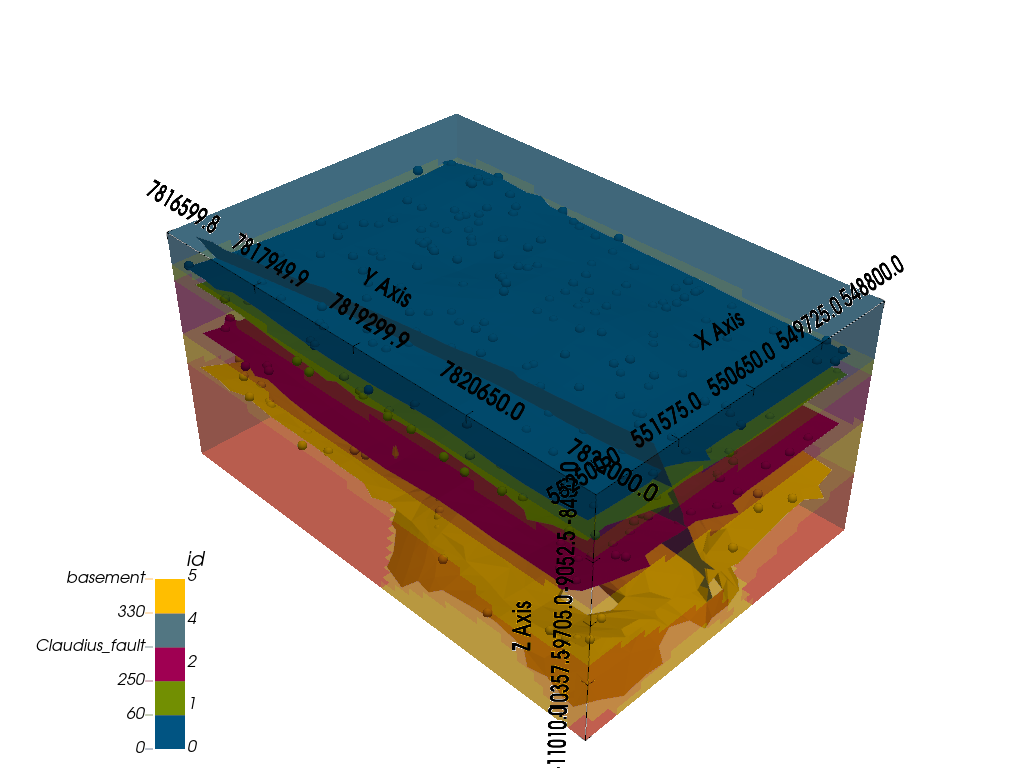
<gempy_viewer.modules.plot_3d.vista.GemPyToVista object at 0x7f56f4192350>
Total running time of the script: (0 minutes 48.673 seconds)
