Note
Go to the end to download the full example code.
Model 2 - Anticline
Simple model of an anticline
This script demonstrates how to create a geological model of an anticline structure using GemPy, a Python-based, open-source library for implicit geological modeling.
# Import necessary libraries
import gempy as gp
import gempy_viewer as gpv

# sphinx_gallery_thumbnail_number = 2
Generate the model
Define the path to the input data
data_path = 'https://raw.githubusercontent.com/cgre-aachen/gempy_data/master/'
path_to_data = data_path + "/data/input_data/jan_models/"

# Create a GeoModel instance
geo_model = gp.create_geomodel(
    project_name='fold',
    extent=[0, 1000, 0, 1000, 0, 1000],
    refinement=6,
    importer_helper=gp.data.ImporterHelper(
        path_to_orientations=path_to_data + "model2_orientations.csv",
        path_to_surface_points=path_to_data + "model2_surface_points.csv"
    )
)

# Map geological series to surfaces
gp.map_stack_to_surfaces(
    gempy_model=geo_model,
    mapping_object={"Strat_Series": ('rock2', 'rock1')}
)

# Compute the geological model
gp.compute_model(geo_model)
Surface points hash:  2790bb25dce52b1a99e4a95e3e9dc276a842dbcc863051d0a4cf4169a8de9a6e
Orientations hash:  26fda5d7c0a74291d5fa18f880aeb84c106af0b771f95af103a025e4e80c4669
Setting Backend To: AvailableBackends.PYTORCH
GPU requested but unavailable; falling back to CPU (GEMPY_GPU_FALLBACK=True)
Setting Backend To: AvailableBackends.PYTORCH
Chunking done: 7 chunks
2D visualization
Plot the initial input data in the y direction, without computed results
gpv.plot_2d(geo_model, direction=['y'], show_results=False)
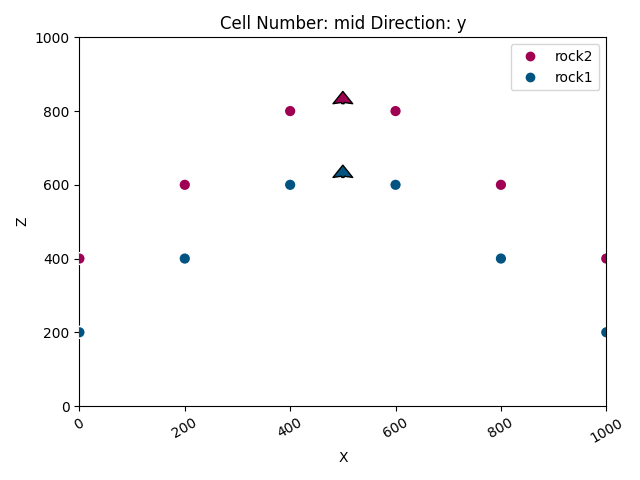
<gempy_viewer.modules.plot_2d.visualization_2d.Plot2D object at 0x7f9a071c4650>
Plot the computed result in the y and x directions, with data
gpv.plot_2d(geo_model, direction='y', show_data=True)
gpv.plot_2d(geo_model, direction='x', show_data=True)
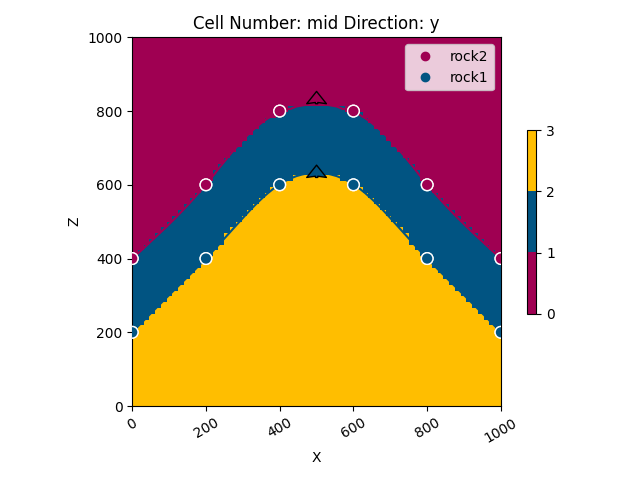
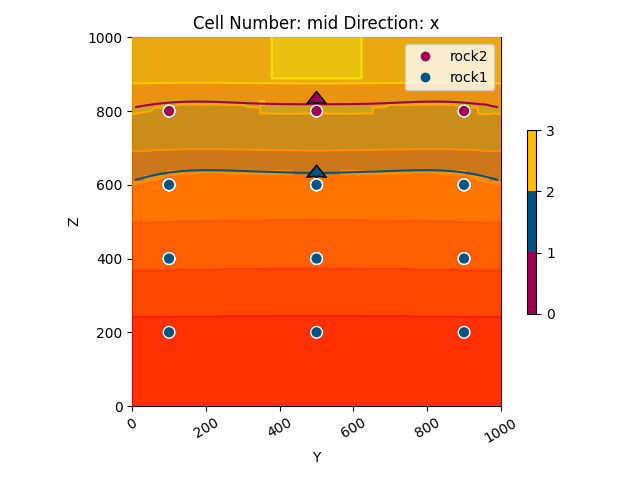
<gempy_viewer.modules.plot_2d.visualization_2d.Plot2D object at 0x7f9a0744a1d0>
3D visualization
Display the computed model in 3D
gpv.plot_3d(geo_model, show_lith=True, show_boundaries=True, ve=None)
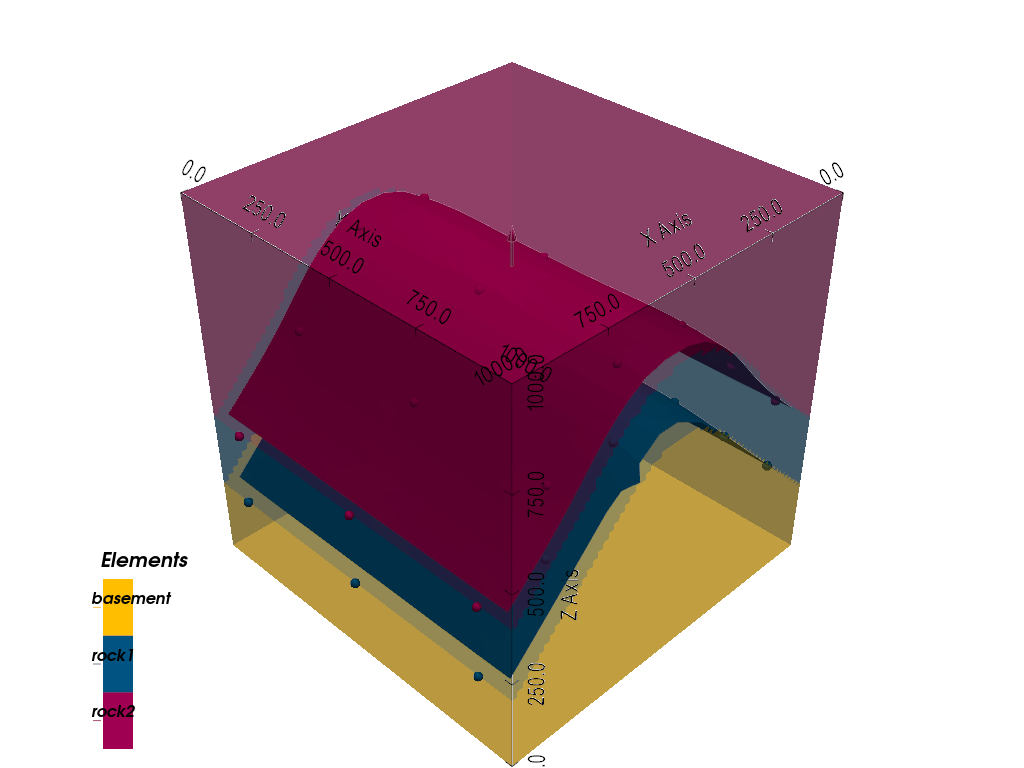
<gempy_viewer.modules.plot_3d.vista.GemPyToVista object at 0x7f99f73beb30>
Total running time of the script: (0 minutes 2.072 seconds)